
The dip buyers in the GBPUSD
GBP/USD
The GBP/USD is the currency pair encompassing the United Kingdom’s currency, the British pound sterling (symbol £, code GBP), and the dollar of the United States of America (symbol $, code USD). The pair’s rate indicates how many US dollars are needed in order to purchase one British pound. For example, when the GBP/USD is trading at 1.5000, it means 1 pound is equivalent to 1.5 dollars. The GBP/USD is the fourth most traded currency pair on the forex exchange market, giving it ample liquidity and a low spread. Whilst the spreads of currency pairs vary from broker to broker, generally speaking, the GBP/USD often stays within the 1 pip to 3 pip spread range, making it a decent candidate for scalping. The GBP/USD pair, also informally known as “cable” (due to transatlantic cables being used to transmit its exchange rate via telegraph back in the 19th century) has a positive correlation with the EUR/USD, and a negative correlation with the USD/CHF. Trading the GBP/USDWhilst a lot of traders and even brokers will assert that the best time to trade the GBP/USD is during its most active hours during London and New York, doing so can be a double-edged sword due to the often-unpredictable nature of the pair. Its volatility also fluctuates often, and so what could be a profitable looking strategy one month, may not be so productive in later months. In addition, purely technical traders can really struggle to be consistent with this pair, (i.e. by ignoring fundamentals), due to the unique political nature of the United Kingdom. The recent drama surrounding Brexit has added another layer of uncertainty to this currency pair. With a smooth resolution not in the cards for the foreseeable future, it is clear the GBP/USD will be influenced by any developments and negotiations with the European Union.
The GBP/USD is the currency pair encompassing the United Kingdom’s currency, the British pound sterling (symbol £, code GBP), and the dollar of the United States of America (symbol $, code USD). The pair’s rate indicates how many US dollars are needed in order to purchase one British pound. For example, when the GBP/USD is trading at 1.5000, it means 1 pound is equivalent to 1.5 dollars. The GBP/USD is the fourth most traded currency pair on the forex exchange market, giving it ample liquidity and a low spread. Whilst the spreads of currency pairs vary from broker to broker, generally speaking, the GBP/USD often stays within the 1 pip to 3 pip spread range, making it a decent candidate for scalping. The GBP/USD pair, also informally known as “cable” (due to transatlantic cables being used to transmit its exchange rate via telegraph back in the 19th century) has a positive correlation with the EUR/USD, and a negative correlation with the USD/CHF. Trading the GBP/USDWhilst a lot of traders and even brokers will assert that the best time to trade the GBP/USD is during its most active hours during London and New York, doing so can be a double-edged sword due to the often-unpredictable nature of the pair. Its volatility also fluctuates often, and so what could be a profitable looking strategy one month, may not be so productive in later months. In addition, purely technical traders can really struggle to be consistent with this pair, (i.e. by ignoring fundamentals), due to the unique political nature of the United Kingdom. The recent drama surrounding Brexit has added another layer of uncertainty to this currency pair. With a smooth resolution not in the cards for the foreseeable future, it is clear the GBP/USD will be influenced by any developments and negotiations with the European Union.
Read this Term today bounced the price off /near a nice round natural support level
Support Level
A trading support or support level represents a given price that acts as a temporary barrier for an asset. In particular, this level ensures an asset’s price will not fall below it or will encounter difficulty in doing so.All assets can utilize supports, be it forex, equities, commodities, etc. A given asset’s support level is created by buyers that enter the market whenever the asset falls to a lower price. Basic support levels can be calculated and charted by identifying the lowest lows for a time period being considered. This can occur over any period, be it daily, hourly, etc.A support line can be either flat or skewed up or down relative to the overall price trend. Looking deeper, other technical indicators and charting techniques can be used to identify more advanced versions of support.Support levels differ from resistance, which illustrate the opposite direction of price movements.Understanding Support LevelsWhen the price of an asset falls towards a defined support level, the asset can either hold at this level or fall further. In this case, additional supports must be identified to compensate for a breach or decline.Support levels in many assets can be created by limit orders or simply the market action of traders and investors.Traders can rely on support levels to plan either entry and exit points for trades, as well as crafting more detailed trading strategies. For example, if the price action on a chart falls below a support level, it is seen as an opportunity to buy or take a short position. Additionally, if this breach of the support level occurs during uptrend, it may possibly be a sign of a reversal and strength.
A trading support or support level represents a given price that acts as a temporary barrier for an asset. In particular, this level ensures an asset’s price will not fall below it or will encounter difficulty in doing so.All assets can utilize supports, be it forex, equities, commodities, etc. A given asset’s support level is created by buyers that enter the market whenever the asset falls to a lower price. Basic support levels can be calculated and charted by identifying the lowest lows for a time period being considered. This can occur over any period, be it daily, hourly, etc.A support line can be either flat or skewed up or down relative to the overall price trend. Looking deeper, other technical indicators and charting techniques can be used to identify more advanced versions of support.Support levels differ from resistance, which illustrate the opposite direction of price movements.Understanding Support LevelsWhen the price of an asset falls towards a defined support level, the asset can either hold at this level or fall further. In this case, additional supports must be identified to compensate for a breach or decline.Support levels in many assets can be created by limit orders or simply the market action of traders and investors.Traders can rely on support levels to plan either entry and exit points for trades, as well as crafting more detailed trading strategies. For example, if the price action on a chart falls below a support level, it is seen as an opportunity to buy or take a short position. Additionally, if this breach of the support level occurs during uptrend, it may possibly be a sign of a reversal and strength.
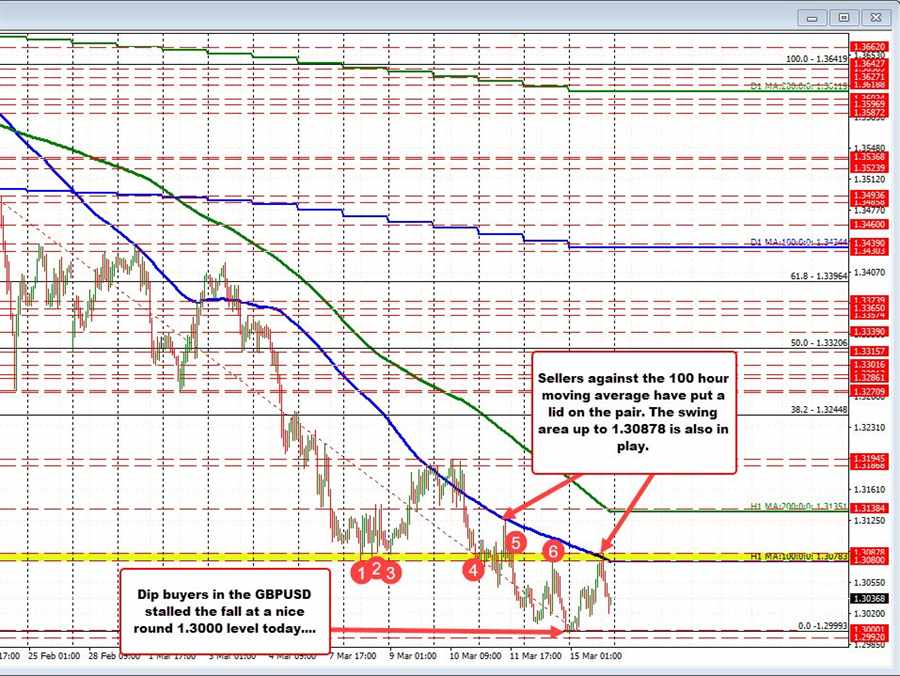
Read this Term at 1.3000 (the low reached 1.29993). The price moved higher into the North American session and approach the falling 100 hour moving average, and also a swing area between 1.3080 and 1.30878. The price was able to extend briefly above the 100 hour moving average, but moved up to the upper extreme of the swing area and found willing sellers.
Buyers turned sellers, and the last five or six hours has seen the price rotate back to the downside.
The current price trades at 1.3038 after reaching a afternoon session low at 1.3020.
What next?
Unfortunately, the story remains the same. The falling 100 hour moving average (blue line in the chart above) along with the swing area up to 1.30878 needs to be broken if the buyers are to take more control.
Absent that and the downside remains the dominant bias. On the downside the 1.3000 level remains a natural support target. Move below that level, and the sellers can probe further.


