Forex Review Online
No Result
View All Result
  • Home
  • Crypto
  • Education
  • News
start trading today
  • Home
  • Crypto
  • Education
  • News
No Result
View All Result
Forex Review Online
No Result
View All Result
Home ANALYSIS

Guess what? The EURUSD stalls near 200 hour MA

A.R Chowdhury by A.R Chowdhury
March 24, 2022
Reading Time: 4 mins read
0
Guess what? The EURUSD stalls near 200 hour MA

EURUSD

EURUSD solidifies support and resistance

RELATED POSTS

EURGBP erases gains and returns to a familiar bias defining level

New highs for US stocks. The Nasdaq continues to lead

USDJPY has 3 key technical levels that have stalled the rally higher today

Guess what?

The 200 hour MA held resistance in the  EURUSD 
EUR/USD

The EUR/USD is the currency pair encompassing the European Union’s single currency, the euro (symbol €, code EUR), and the dollar of the United States (symbol $, code USD). The pair’s rate indicates how many euros are needed in order to purchase one dollar. For example, when the EUR/USD is trading at 1.2, it means 1 euro is equivalent to 1.2 dollars.  Why the EUR/USD is the Most Popular Trading PairCompared to all tradable currencies, the euro (EUR) is the world’s second most traded currency, behind only the US dollar. This currency pair is the most traded and liquid currency pair on the market.As the most popular trading pair, the EUR/USD is a staple of every brokerage offering and often has some of the lowest spreads relative to other pairs. Ultimately, the currency follows the two most economic blocs in the world and sees the most volume for this reason.The EUR/USD has a wide range of factors that influence its rates. From the EUR side, economic data in the Eurozone as well as internal factors in the bloc can easily impact rates. Even small member states can effectively weigh on the EUR, as seen in Greece during bailout talks in the 2010s. Alternatively, developments in the United States and the Federal Reserve commonly affect the EUR/USD. Many examples include the bailouts during the Financial crisis, tax cuts during the Trump Administration, and Covid-19 relief measures, among others.

The EUR/USD is the currency pair encompassing the European Union’s single currency, the euro (symbol €, code EUR), and the dollar of the United States (symbol $, code USD). The pair’s rate indicates how many euros are needed in order to purchase one dollar. For example, when the EUR/USD is trading at 1.2, it means 1 euro is equivalent to 1.2 dollars.  Why the EUR/USD is the Most Popular Trading PairCompared to all tradable currencies, the euro (EUR) is the world’s second most traded currency, behind only the US dollar. This currency pair is the most traded and liquid currency pair on the market.As the most popular trading pair, the EUR/USD is a staple of every brokerage offering and often has some of the lowest spreads relative to other pairs. Ultimately, the currency follows the two most economic blocs in the world and sees the most volume for this reason.The EUR/USD has a wide range of factors that influence its rates. From the EUR side, economic data in the Eurozone as well as internal factors in the bloc can easily impact rates. Even small member states can effectively weigh on the EUR, as seen in Greece during bailout talks in the 2010s. Alternatively, developments in the United States and the Federal Reserve commonly affect the EUR/USD. Many examples include the bailouts during the Financial crisis, tax cuts during the Trump Administration, and Covid-19 relief measures, among others.
Read this Term
. Surprise. Surprise.

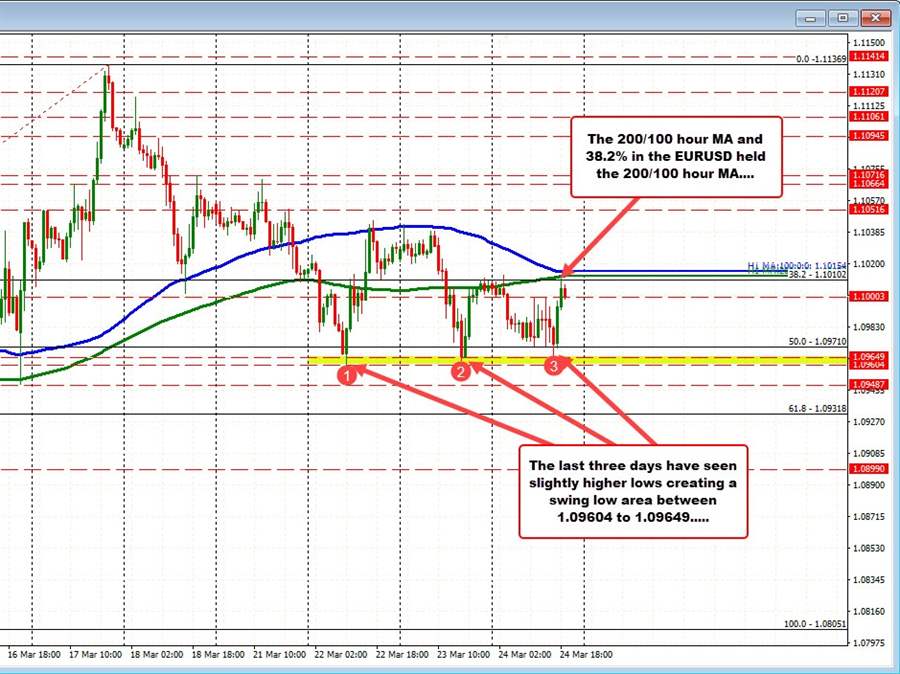
The 200 hour MA (green line) has acted as a barometer for bullish and bearish going back to last week. There have been a number of moves above and below the moving average, but the price tends to react to it shifting the bias on breaks (or holds) one way or the other.

The 100 hour moving average (blue line) is also been in play, and a bias defining technical level. Both on Tuesday and Wednesday this week, the price highs stalled near the 100 hour moving average. That kept the sellers more control/in play.

Today as outlined in a earlier post, the price highs stalled near both the 200 hour moving average and 38.2% retracement early in the Asian session. There was a brief try above each in the Asian session, but the price failed, and the price started to move back to the downside.

The move lower did try to stall at the 50% midpoint early in the US session, but then broke below. However, the lows from Tuesday and Wednesday could not be broken next (the last 3 days has seen marginally higher). That swing low dynamic now makes swing area between 1.09604 and 1.09649 as a new swing floor. Getting below would be needed to solicit more selling now.

The subsequent move higher in the US session has not only seen the 200 hour MA hold resistance, but also the 38.2% and the falling 100 hour MA. All those levels now come between 1.1010 and 1.10154.

The current price is back down at 1.0993 currently.

So the battle lines above and below remain the same but have increased in importance given the tests:

  • On the upside, the 1.1010 to 1.10154 (home to the 100/200 hour moving averages and 38.2% retracement) is resistance
  • On the downside, the 1.0960 to 1.09649 is support. That area represents swing lows from Tuesday, Wednesday, Thursday.

On a break of either extreme, I would now look for momentum in the direction of the break. Until then, buyers and sellers battle it out with the extremes providing the support and resistance.

ADVERTISEMENT – CONTINUE READING BELOW

Source link

ShareTweetPin
A.R Chowdhury

A.R Chowdhury

Related Posts

EURGBP erases gains and returns to a familiar bias defining level
ANALYSIS

EURGBP erases gains and returns to a familiar bias defining level

August 14, 2022
New highs for US stocks. The Nasdaq continues to lead
ANALYSIS

New highs for US stocks. The Nasdaq continues to lead

August 14, 2022
USDJPY has 3 key technical levels that have stalled the rally higher today
ANALYSIS

USDJPY has 3 key technical levels that have stalled the rally higher today

August 14, 2022
WTI crude oil futures settle at $92.09
ANALYSIS

WTI crude oil futures settle at $92.09

August 14, 2022
Bitcoin technical analysis, bulls might be giving up soon
ANALYSIS

Bitcoin technical analysis, bulls might be giving up soon

August 14, 2022
The weekend forex technical report for the week of August 15, 2022
ANALYSIS

The weekend forex technical report for the week of August 15, 2022

August 14, 2022
Next Post
EURJPY continues to work through the swing highs going back to mid-2021

EURJPY continues to work through the swing highs going back to mid-2021

USDMXN lower after the leaked (by the Mexican President) 50 basis point hike

USDMXN lower after the leaked (by the Mexican President) 50 basis point hike

Leave a Reply Cancel reply

Your email address will not be published. Required fields are marked *

Recommended Stories

Dollar holds its ground in quiet trading so far

May 8, 2020
USDCHF sellers had a shot today. It did not go well.

USDCHF sellers had a shot today. It did not go well.

March 18, 2022

AUDUSD moves away from 2021 low at 0.72889

August 17, 2021

Popular Stories

  • New highs for US stocks. The Nasdaq continues to lead

    New highs for US stocks. The Nasdaq continues to lead

    0 shares
    Share 0 Tweet 0
  • The USD is the strongest and the NZD is the weakest as the NA session begins

    0 shares
    Share 0 Tweet 0
  • EURGBP erases gains and returns to a familiar bias defining level

    0 shares
    Share 0 Tweet 0
  • What is forex and How does it work?

    0 shares
    Share 0 Tweet 0
  • Bitcoin technical analysis, bulls might be giving up soon

    0 shares
    Share 0 Tweet 0
Forex Review Online

© 2022 My Forex Review - Designed with Jnews Theme.

Navigate Site

  • Home
  • Crypto
  • Education
  • News

Follow Us

No Result
View All Result
  • Home
  • Crypto
  • Education
  • News

© 2022 My Forex Review - Designed with Jnews Theme.