
The low today tested a swing area on the daily chart
The EURGBP broke below its 100 day MA last week and has closed below the level in each of the days this week. That MA comes in at 0.89469 (blue line in the chart below). The close below was the first since February 26th. That is asignificant break. Going forward, staying below that MA, keeps the sellers more in control from a longer term perspective.
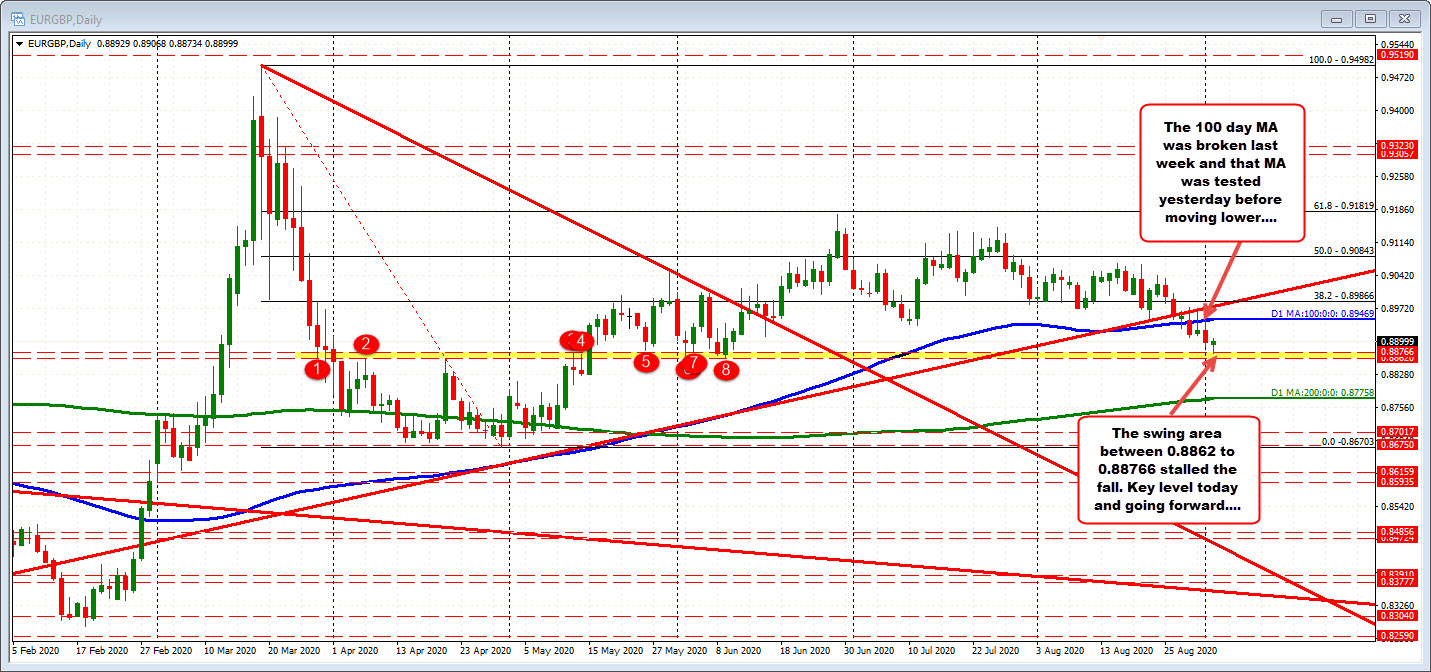
Having said that, the momentum lower must be maintained by getting below the next targets and creating new resistance levels in the direction of the bias (in this case to the downside). The fall away from the 100 day MA has found support buyers near a swing area between 0.8862 to 0.88766. The low today reached 0.88734 between the two levels. The price has bounced off that support (see red numbered circles in the chart below).
So there is some reluctance at the next support target. The battle is on.
Drilling to the hourly chart below, the pair has been trending more to the downside since breaking below its 100 hour MA (blue line in chart below) on August 25th. There was a brief peek above the MA on Monday, but that was quickly rejected. The high yesterday stalled just below that 100 hour MA (and 100 day MA as well).
Yesterday, the price moved below the swing low from Friday at 0.89077, but waffled up and down over in the NY session yesterday before closing below the level. The high prices today in the London and NY session stalled ahead of that level increasing the levels importance (see green numbered circles in the chart below).
That creates a ceiling to get to and thrugh IF the buyers are to take more control. Above that, the 0.89178 level and the falling 100 hour MA are still targets that would need to be broken (and stay broken) for the buyers to take more control from the sellers.
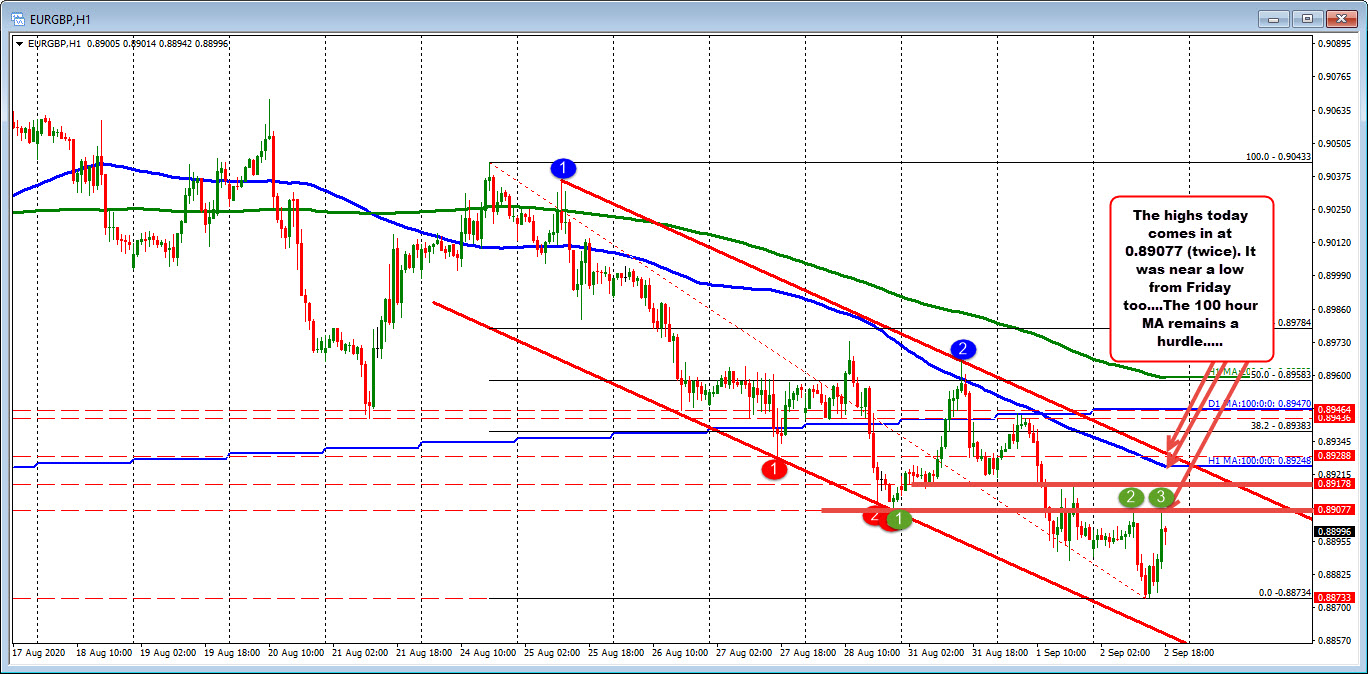
We know there is a battle on the daily chart. There is one on the hourly chart as well. The levels are clear. The “market” has to now decide which way it wants to go.


