Forex Review Online
No Result
View All Result
  • Home
  • Crypto
  • Education
  • News
start trading today
  • Home
  • Crypto
  • Education
  • News
No Result
View All Result
Forex Review Online
No Result
View All Result
Home ANALYSIS

Both the NASDAQ and S&P stalled against a key hourly moving average today. What was it?

A.R Chowdhury by A.R Chowdhury
March 3, 2022
Reading Time: 3 mins read
0
Both the NASDAQ and S&P stalled against a key hourly moving average today. What was it?

The major indices are trading mixed with the Dow industrial average up 0.34%. The S&P index of 0.16% while the NASDAQ index is down -0.56% currently.

NASDAQ index

Tests the 200 hour moving average and stalls

RELATED POSTS

EURGBP erases gains and returns to a familiar bias defining level

New highs for US stocks. The Nasdaq continues to lead

USDJPY has 3 key technical levels that have stalled the rally higher today

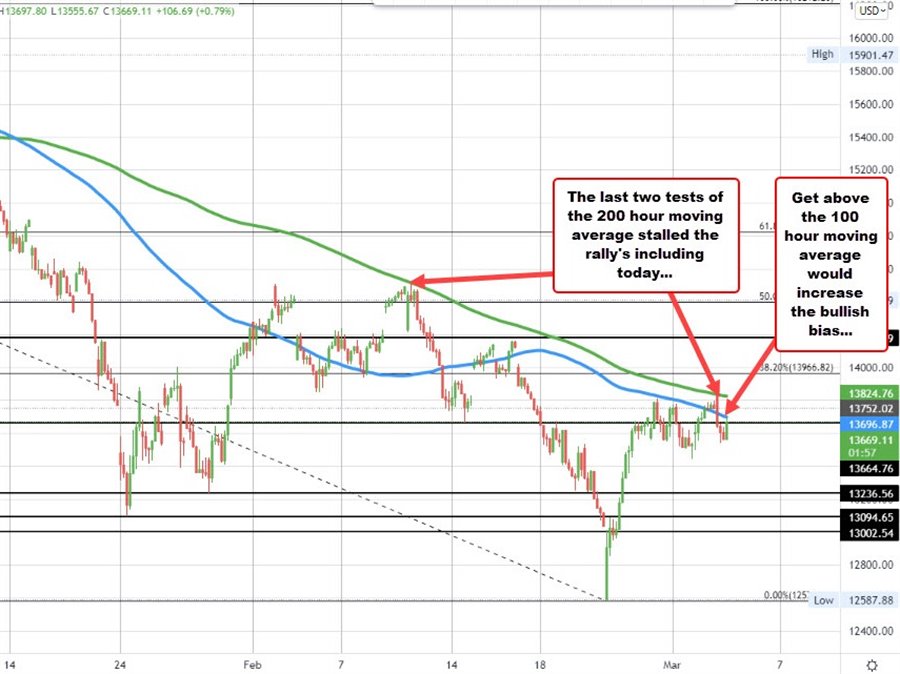
If you were to look at the hourly chart of the NASDAQ index above, the high for the day at 13837.59 stalled right near its 200 hour moving average (green line in the chart above). Sellers leaned against the level and pushed the price to the downside.

On the way back down, the price fell back below its 100 hour moving average (blue line in the chart above) currently at 13696.86.

The price is currently moving back toward that level. Move above it should have traders retargeting the aforementioned 200 hour moving average currently at 13824.74.

PS. Back on February 10, the price also tested the 200 hour moving average and found willing sellers. As a result, the moving average becomes more important for traders going forward. Move above should increase the bullish bias and have traders looking toward the 13966 level (38.2% retracement). Move above that and traders will look toward the 14,000 level.

Looking at the hourly chart of the S&P index below, the high price today that 4416.78 also stalled right at the 200 hour moving average (green line). Like the NASDAQ index, sellers leaned against the risk of finding level, and push the price back below its 100 hour moving average.

Unlike the NASDAQ, the price has been able to extend back above its 100 hour moving average (blue line currently at 4372.01). The 200 hour moving average of 4415.72 currently (and moving lower) is the next hurdle to get to and through. Move above and traders would target the 50% midpoint of the move down from the January high to the January low. That level comes in at 4466.64. Get and stay above that level would add to the short-term bullish bias.

Conversely of the 200 hour moving average cannot be broken, the sellers remain in control and we could see rotation back below the 100 hour moving average before the close and potentially back down toward the 4278.94 swing low from earlier this week.

S&P

S&P index stalled against its 200 hour moving average

So the 200 hour moving average was “wild” today from a technical perspective. The moving average on the NASDAQ and S&P charts stalled the rally’s and sent the price back to the downside. The prices are trying to rebound. If the price can continue to rebound, and get through the 200 hour moving average on each chart, the technical bias would shift more in the favor of the buyers.

ADVERTISEMENT – CONTINUE READING BELOW

Source link

ShareTweetPin
A.R Chowdhury

A.R Chowdhury

Related Posts

EURGBP erases gains and returns to a familiar bias defining level
ANALYSIS

EURGBP erases gains and returns to a familiar bias defining level

August 14, 2022
New highs for US stocks. The Nasdaq continues to lead
ANALYSIS

New highs for US stocks. The Nasdaq continues to lead

August 14, 2022
USDJPY has 3 key technical levels that have stalled the rally higher today
ANALYSIS

USDJPY has 3 key technical levels that have stalled the rally higher today

August 14, 2022
WTI crude oil futures settle at $92.09
ANALYSIS

WTI crude oil futures settle at $92.09

August 14, 2022
Bitcoin technical analysis, bulls might be giving up soon
ANALYSIS

Bitcoin technical analysis, bulls might be giving up soon

August 14, 2022
The weekend forex technical report for the week of August 15, 2022
ANALYSIS

The weekend forex technical report for the week of August 15, 2022

August 14, 2022
Next Post
The NZD is the strongest and the EUR is the weakest as the NA session begins

The NZD is the strongest and the EUR is the weakest as the NA session begins

USDJPY tests 100/200 hour MA levels.

USDJPY tests 100/200 hour MA levels.

Leave a Reply Cancel reply

Your email address will not be published. Required fields are marked *

Recommended Stories

NZDUSD consolidates the declines. Wanders lower during the week.

April 4, 2020

Stocks close the week with positive gains for the 1st time in 3 weeks

May 8, 2020
WTI crude oil futures settle at $123.70

WTI crude oil futures settle at $123.70

March 8, 2022

Popular Stories

  • New highs for US stocks. The Nasdaq continues to lead

    New highs for US stocks. The Nasdaq continues to lead

    0 shares
    Share 0 Tweet 0
  • The USD is the strongest and the NZD is the weakest as the NA session begins

    0 shares
    Share 0 Tweet 0
  • EURGBP erases gains and returns to a familiar bias defining level

    0 shares
    Share 0 Tweet 0
  • What is forex and How does it work?

    0 shares
    Share 0 Tweet 0
  • Bitcoin technical analysis, bulls might be giving up soon

    0 shares
    Share 0 Tweet 0
Forex Review Online

© 2022 My Forex Review - Designed with Jnews Theme.

Navigate Site

  • Home
  • Crypto
  • Education
  • News

Follow Us

No Result
View All Result
  • Home
  • Crypto
  • Education
  • News

© 2022 My Forex Review - Designed with Jnews Theme.