Forex Review Online
No Result
View All Result
  • Home
  • Crypto
  • Education
  • News
start trading today
  • Home
  • Crypto
  • Education
  • News
No Result
View All Result
Forex Review Online
No Result
View All Result
Home ANALYSIS

The yield curve stays at flattest since 2020. What is that telling us?

A.R Chowdhury by A.R Chowdhury
March 21, 2022
Reading Time: 8 mins read
0
The yield curve stays at flattest since 2020. What is that telling us?

2-10 year spread

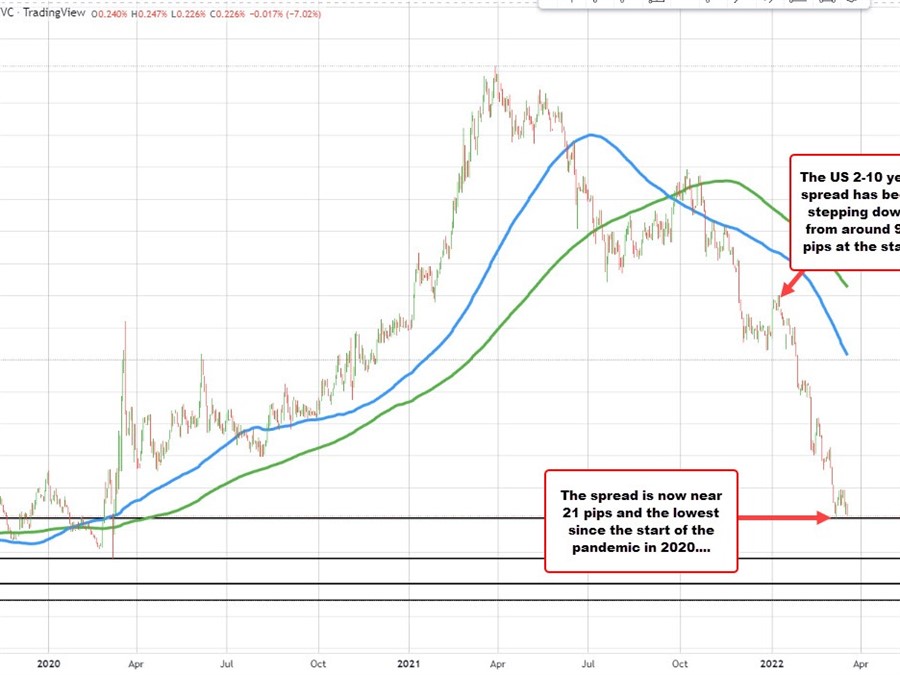
2-10 year spread in the US is near lows since March 2020

The US 2 vs 10 year spread ended the week near 21 basis points last week, and near the lowest levels since the start of the pandemic in March 2020. During that pandemic time period, the spread moved to a low of 8 basis points.

The spread in 2022 has seen a high of around 90 pips on January 10, but has stepped lower since then. The spike in inflation and the the reluctance of the Fed to address it, had traders feeling that the Fed was falling behind the curve. Ultimately, the Fed would have to act and do it aggressively, choking off the economy in the process.

The Russian/Ukraine war is certainly not helping at all as inflation from the supply shock is now being juiced by inflation from the war and it’s impact on commodities like wheat and corn, and nickel and oil. And we all worried it was just a matter of chips, and ships getting into docks and getting the goods distributed. Whoops.

Two or so weeks ago, Fed Chair Powell testified on Capitol Hill. When asked if he was willing to be like Volker to stop inflation. He answered “Yes” without hesitation.

Last Wednesday when the market was expected the Fed to “up” it’s tightening bias to 4-5 times in 2022, they went straight to 7 hikes in 2022. They now see the rate at the end of year at 1.90%. Powell indeed was a bit more Volker-esque.

The questions now for the markets are:

  • Is it too still late?
  • Is the Fed still behind the curve with regard to inflation?
  • Will oil and other commodity rises lead to a cost/push inflation that feeds into expectations rising?
  • Will the need to fight the fight on inflation tip the economy from boom to bust?
  • What will that do to stock? to housing? to jobs?

There is no doubt that the recent history bulked up peoples investment accounts and the shortage of housing sent price skyrocketing as well. With investment accounts and home prices making consumers feel wealthy, it is believed that there is enough momentum to keep the economy going. Moreover, it was thought that if the Fed can make it through the rough patch and inflation DOES start to move back lower as the supply shock unclogs further and the Russian Ukraine war fizzles out, then happy days will be here again with rates more normalized and the balance sheet reduced as well. The Fed get’s out of jail.

However, there are also a ton of things that could go wrong too. The wall of worry was at one height pre-Russia/Ukraine. It is at a different higher height now.

The Fed screamed “uncle” last week with the hawkish dot plot, and the stock market rallied strongly.

However, the 2-10 year spread continued it’s move to the downside and closed near the low since March 2020. The bond market is saying the road ahead for the economy may not be all that great.

Traders will be watching that 2-10 year spread this week. If it continues to soften, look for the stock market to lose it’s enthusiasm as not only fears of slower growth start to show, but earnings estimates start to be ratcheted down as inflationary pressures squeeze earnings.

Housing? The supply thing may be solved by a demand thing as higher rates, and high prices take buyers out of the market.

Technically for the broad US  indices 
Indices

Stock market indices represents an index that measures a particular stock market or a segment of the stock market. These instruments are important investors as they help compare current price levels with past prices to calculate market performance.The main two parameters for indices are that they are both investable and transparent. For example, investors can invest in a stock market index by buying an index fund, which is structured as either a mutual fund or an exchange-traded fund, and track an index. The difference between an index fund’s performance and the index, if any, is called tracking error. Most major countries boast multiple indices. Commonly traded indices include the S&P 500, NASDAQ-100, Dow Jones Industrial Average (DIJA), EURO STOXX 50, Hang Seng Index, and many more.Stock market indices can be characterized or segmented by the index coverage set of stocks. The overall coverage of an index constitutes an underlying group of stocks, most commonly grouped together by underlying investor demand.How to Trade IndicesRetail brokers offer indices exposure through the use of contracts-for-difference (CFDs) or exchange-traded funds (ETFs). Each are popular ways to trade specific markets and are almost always on offer at most brokers.Investors can choose between multiple types of indices that traditionally fall within several categories. This includes country coverage, regional coverage, global coverage, exchange-based coverage, and sector-based coverage.All indices are ultimately weighted in a number of different ways. The most common mechanisms include market-capitalization weighting, free-float adjusted market capitalization weighting, volatility weighting, price weighting, and others.

Stock market indices represents an index that measures a particular stock market or a segment of the stock market. These instruments are important investors as they help compare current price levels with past prices to calculate market performance.The main two parameters for indices are that they are both investable and transparent. For example, investors can invest in a stock market index by buying an index fund, which is structured as either a mutual fund or an exchange-traded fund, and track an index. The difference between an index fund’s performance and the index, if any, is called tracking error. Most major countries boast multiple indices. Commonly traded indices include the S&P 500, NASDAQ-100, Dow Jones Industrial Average (DIJA), EURO STOXX 50, Hang Seng Index, and many more.Stock market indices can be characterized or segmented by the index coverage set of stocks. The overall coverage of an index constitutes an underlying group of stocks, most commonly grouped together by underlying investor demand.How to Trade IndicesRetail brokers offer indices exposure through the use of contracts-for-difference (CFDs) or exchange-traded funds (ETFs). Each are popular ways to trade specific markets and are almost always on offer at most brokers.Investors can choose between multiple types of indices that traditionally fall within several categories. This includes country coverage, regional coverage, global coverage, exchange-based coverage, and sector-based coverage.All indices are ultimately weighted in a number of different ways. The most common mechanisms include market-capitalization weighting, free-float adjusted market capitalization weighting, volatility weighting, price weighting, and others.
Read this Term
this week,

  • The S&P is opening the week near its 200 day MA at 4470.51. Watch that level. If it moves above, it’s good, but if it moves above and comes back below, that would not be good. It’s 200 hour MA is down at 4354.29 currently. Pay attention to that level on the downside. .
  • For the  Nasdaq 
    NASDAQ

    The Nasdaq Stock Market or NASDAQ is an American stock exchange. It trails only the New York Stock Exchange (NYSE) in market capitalization and is part of a network of stock markets and options exchanges.Launched back in 1971, NASDAQ is the acronym for the National Association of Securities Dealers Automated Quotations. Since then it is known simply as NASDAQ and has become one of the most influential exchanges worldwide.The NASDAQ was the world’s first electronic stock market, and has since assumed the majority of major trades that had been executed by the over-the-counter (OTC) system of trading.What Makes Up the NASDAQ?In particular, the exchange also features the NASDAQ Composite, which includes almost all stocks listed on the NASDAQ stock market. Along with the Dow Jones Industrial Average (DIJA) and S&P 500 Index, this is one of the three most-followed stock market indices in the United States.Overall, the NASDAQ stock market has three different market tiers. This includes the Capital Market, or an equity market for companies that have relatively small levels of market capitalization. The listing requirements for small cap companies are less stringent than for other Nasdaq markets that list larger companies with significantly higher market capitalization.Additionally, the Global Market is made up of stocks that represent the Nasdaq Global Market. The Global Market consists of 1,450 stocks that meet the exchange’s financial and liquidity requirements, and corporate governance standards.Finally, the Global Select Market is a market capitalization-weighted index made up of 1,200 US-based and international stocks that represent the Global Select Market Composite.

    The Nasdaq Stock Market or NASDAQ is an American stock exchange. It trails only the New York Stock Exchange (NYSE) in market capitalization and is part of a network of stock markets and options exchanges.Launched back in 1971, NASDAQ is the acronym for the National Association of Securities Dealers Automated Quotations. Since then it is known simply as NASDAQ and has become one of the most influential exchanges worldwide.The NASDAQ was the world’s first electronic stock market, and has since assumed the majority of major trades that had been executed by the over-the-counter (OTC) system of trading.What Makes Up the NASDAQ?In particular, the exchange also features the NASDAQ Composite, which includes almost all stocks listed on the NASDAQ stock market. Along with the Dow Jones Industrial Average (DIJA) and S&P 500 Index, this is one of the three most-followed stock market indices in the United States.Overall, the NASDAQ stock market has three different market tiers. This includes the Capital Market, or an equity market for companies that have relatively small levels of market capitalization. The listing requirements for small cap companies are less stringent than for other Nasdaq markets that list larger companies with significantly higher market capitalization.Additionally, the Global Market is made up of stocks that represent the Nasdaq Global Market. The Global Market consists of 1,450 stocks that meet the exchange’s financial and liquidity requirements, and corporate governance standards.Finally, the Global Select Market is a market capitalization-weighted index made up of 1,200 US-based and international stocks that represent the Global Select Market Composite.
    Read this Term
    index it still has not made it back to the 38.2% of the move down from the November all time high at 13952.28. The price closed at 13893.84. The price needs to get and stay above that retracement to give the buyers some hope that the bottom is in. Absent that, and the correction is not even a plain vanilla variety (it is less than that). Watch that level. On the downside, the 200 hour MA was broken last week and is at 13536.00. Move back below that level and things won’t be looking good either.
ADVERTISEMENT – CONTINUE READING BELOW

Source link

RELATED POSTS

EURGBP erases gains and returns to a familiar bias defining level

New highs for US stocks. The Nasdaq continues to lead

USDJPY has 3 key technical levels that have stalled the rally higher today

ShareTweetPin
A.R Chowdhury

A.R Chowdhury

Related Posts

EURGBP erases gains and returns to a familiar bias defining level
ANALYSIS

EURGBP erases gains and returns to a familiar bias defining level

August 14, 2022
New highs for US stocks. The Nasdaq continues to lead
ANALYSIS

New highs for US stocks. The Nasdaq continues to lead

August 14, 2022
USDJPY has 3 key technical levels that have stalled the rally higher today
ANALYSIS

USDJPY has 3 key technical levels that have stalled the rally higher today

August 14, 2022
WTI crude oil futures settle at $92.09
ANALYSIS

WTI crude oil futures settle at $92.09

August 14, 2022
Bitcoin technical analysis, bulls might be giving up soon
ANALYSIS

Bitcoin technical analysis, bulls might be giving up soon

August 14, 2022
The weekend forex technical report for the week of August 15, 2022
ANALYSIS

The weekend forex technical report for the week of August 15, 2022

August 14, 2022
Next Post
WTI crude hits $110 per barrel. What levels to watch for next

WTI crude hits $110 per barrel. What levels to watch for next

EURUSD tests the 200 hour MA. The last few tests have held support near the MA level

EURUSD tests the 200 hour MA. The last few tests have held support near the MA level

Leave a Reply Cancel reply

Your email address will not be published. Required fields are marked *

Recommended Stories

European shares mostly lower on the day

May 6, 2020

USDCHF snaps higher

August 11, 2020

Euro threatens 1.1700 in potential fall to the lowest since November

August 17, 2021

Popular Stories

  • The USD is the strongest and the NZD is the weakest as the NA session begins

    0 shares
    Share 0 Tweet 0
  • New highs for US stocks. The Nasdaq continues to lead

    0 shares
    Share 0 Tweet 0
  • EURGBP erases gains and returns to a familiar bias defining level

    0 shares
    Share 0 Tweet 0
  • What is forex and How does it work?

    0 shares
    Share 0 Tweet 0
  • What is CFD trading?

    0 shares
    Share 0 Tweet 0
Forex Review Online

© 2022 My Forex Review - Designed with Jnews Theme.

Navigate Site

  • Home
  • Crypto
  • Education
  • News

Follow Us

No Result
View All Result
  • Home
  • Crypto
  • Education
  • News

© 2022 My Forex Review - Designed with Jnews Theme.