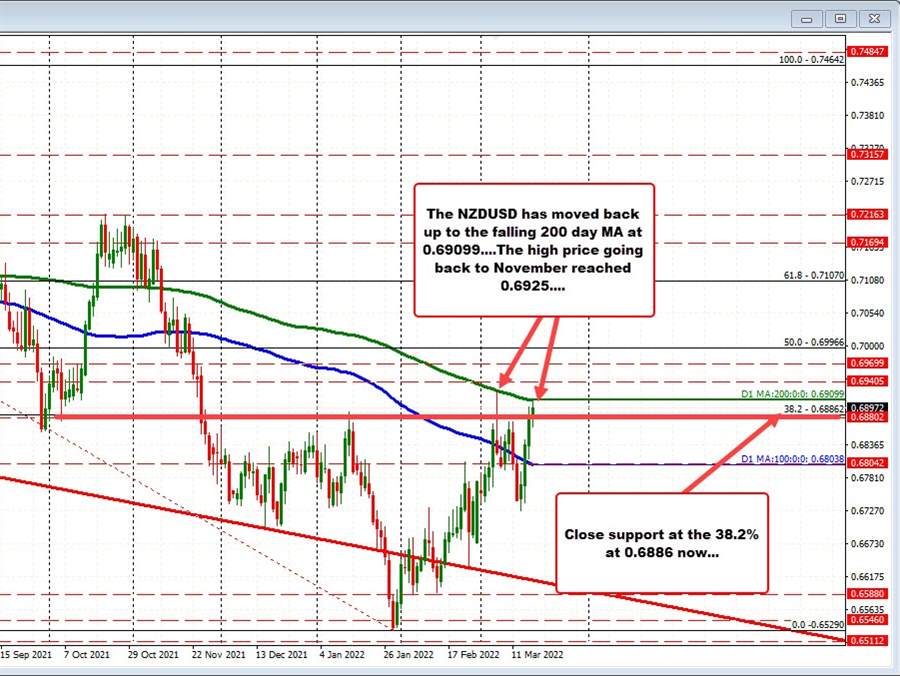
Forex Review Online
No Result
View All Result
  • Home
  • Crypto
  • Education
  • News
start trading today
  • Home
  • Crypto
  • Education
  • News
No Result
View All Result
Forex Review Online
No Result
View All Result
Home ANALYSIS

NZDUSD retests the 200 day MA at 0.69099

A.R Chowdhury by A.R Chowdhury
March 18, 2022
Reading Time: 4 mins read
0
NZDUSD retests the 200 day MA at 0.69099

NZDUSD

NZDUSD retest its 200 day moving average today

The  NZDUSD 
NZD/USD

The NZD/USD is a commonly offered currency pair representing the New Zealand dollar or Kiwi and US dollar.  The pair is popular for exposure into a commodity currency, i.e. the NZD, which helps capture risk appetite for forex traders. Like its Antipodean counterpart, the Australian Dollar, the NZD/USD is seen as a carry trade, due in part to interest rate differentials which favor the NZD. The NZD is the world’s seventh most liquid pair at the time of writing with the USD being the world’s most traded currency and the NZD being the tenth. What Affects the NZD/USD? The NZD/USD is offered at virtually every retail forex brokerage and is a common pair for traders to have experience with.  The pair moves on investor sentiment and can be much more volatile than other pairs such as the EUR/USD, GBP/USD and others. Given New Zealand is the world’s largest exporter of milk powder, this metric is a key factor when driving the pair. Any sensitivity to milk powder exports is captured via the NZD/USD. Additionally, tourism is a key contributor to the New Zealand economy and as such help move the currency pair.  Other factors of note for the NZD/USD include export volumes to China as well as other important economic data releases from China.  Central banks also play a primary role in the direction of the currency pair with both the US Federal Reserve and the Reserve Bank of New Zealand being closely monitored by investors.  Monetary policy is more than capable of abruptly moving the NZD/USD, which can oscillate much more than other normal pairs.

The NZD/USD is a commonly offered currency pair representing the New Zealand dollar or Kiwi and US dollar.  The pair is popular for exposure into a commodity currency, i.e. the NZD, which helps capture risk appetite for forex traders. Like its Antipodean counterpart, the Australian Dollar, the NZD/USD is seen as a carry trade, due in part to interest rate differentials which favor the NZD. The NZD is the world’s seventh most liquid pair at the time of writing with the USD being the world’s most traded currency and the NZD being the tenth. What Affects the NZD/USD? The NZD/USD is offered at virtually every retail forex brokerage and is a common pair for traders to have experience with.  The pair moves on investor sentiment and can be much more volatile than other pairs such as the EUR/USD, GBP/USD and others. Given New Zealand is the world’s largest exporter of milk powder, this metric is a key factor when driving the pair. Any sensitivity to milk powder exports is captured via the NZD/USD. Additionally, tourism is a key contributor to the New Zealand economy and as such help move the currency pair.  Other factors of note for the NZD/USD include export volumes to China as well as other important economic data releases from China.  Central banks also play a primary role in the direction of the currency pair with both the US Federal Reserve and the Reserve Bank of New Zealand being closely monitored by investors.  Monetary policy is more than capable of abruptly moving the NZD/USD, which can oscillate much more than other normal pairs.
Read this Term
has moved up to retest its 200 day moving average today. That level comes in at 0.69099. The high price reached 0.69089 and backed off. The current price is trading at 0.6895.

Traders tested that 200 hour moving average earlier this month and found sellers against that level at that time too. The last time the price closed above its 200 day moving average was back on November 9, 2021. It is been 93 days since the last closed above the key level.

RELATED POSTS

EURGBP erases gains and returns to a familiar bias defining level

New highs for US stocks. The Nasdaq continues to lead

USDJPY has 3 key technical levels that have stalled the rally higher today

The move to the upside this week was able to extend above the 38.2% retracement at 0.6886. Traders may look to that level as a barometer going forward. If the price can stay above, a break above the 200 day moving average should be an easier hurdle. Move back below (and the price has been below today), and there could be disappointment into the weekend (and into next week).

Looking at the hourly chart below, the price action has been up and down over the last 24 or so hours. There is some ceilings near the 0.68997 area (call it 0.6900). Although the price moved above that level on its way to retest the 200 day moving average, sellers have leaned against that level since the failed break. Watch that level in the short term.

On the downside in the ups and downs of recent price activity, the 0.6870 to 0.68745 will be eyed. Earlier today after Fed’s Waller’s comments, the price did move below those levels, but quickly rebounded. A move back below the levels would give sellers more confidence that there would be further downside potential. Additional downside targets would come in at 0.68577 and 0.68317.

NZDUSD

NZDUSD traded up and down between short-term swing areas
ADVERTISEMENT – CONTINUE READING BELOW

Source link

ShareTweetPin
A.R Chowdhury

A.R Chowdhury

Related Posts

EURGBP erases gains and returns to a familiar bias defining level
ANALYSIS

EURGBP erases gains and returns to a familiar bias defining level

August 14, 2022
New highs for US stocks. The Nasdaq continues to lead
ANALYSIS

New highs for US stocks. The Nasdaq continues to lead

August 14, 2022
USDJPY has 3 key technical levels that have stalled the rally higher today
ANALYSIS

USDJPY has 3 key technical levels that have stalled the rally higher today

August 14, 2022
WTI crude oil futures settle at $92.09
ANALYSIS

WTI crude oil futures settle at $92.09

August 14, 2022
Bitcoin technical analysis, bulls might be giving up soon
ANALYSIS

Bitcoin technical analysis, bulls might be giving up soon

August 14, 2022
The weekend forex technical report for the week of August 15, 2022
ANALYSIS

The weekend forex technical report for the week of August 15, 2022

August 14, 2022
Next Post
EURUSD bounces off 200 hour MA ….again

EURUSD bounces off 200 hour MA ....again

AUDUSD trades back toward highs for day/week

AUDUSD trades back toward highs for day/week

Leave a Reply Cancel reply

Your email address will not be published. Required fields are marked *

Recommended Stories

European shares end the session with strong gains

May 19, 2020

It’s the last hour of the day (and week)… Buckle your seat belt

April 3, 2020

Dow leads the charge as Nasdaq gives up some gains.

July 13, 2020

Popular Stories

  • New highs for US stocks. The Nasdaq continues to lead

    New highs for US stocks. The Nasdaq continues to lead

    0 shares
    Share 0 Tweet 0
  • The USD is the strongest and the NZD is the weakest as the NA session begins

    0 shares
    Share 0 Tweet 0
  • EURGBP erases gains and returns to a familiar bias defining level

    0 shares
    Share 0 Tweet 0
  • What is forex and How does it work?

    0 shares
    Share 0 Tweet 0
  • Bitcoin technical analysis, bulls might be giving up soon

    0 shares
    Share 0 Tweet 0
Forex Review Online

© 2022 My Forex Review - Designed with Jnews Theme.

Navigate Site

  • Home
  • Crypto
  • Education
  • News

Follow Us

No Result
View All Result
  • Home
  • Crypto
  • Education
  • News

© 2022 My Forex Review - Designed with Jnews Theme.