Forex Review Online
No Result
View All Result
  • Home
  • Crypto
  • Education
  • News
start trading today
  • Home
  • Crypto
  • Education
  • News
No Result
View All Result
Forex Review Online
No Result
View All Result
Home ANALYSIS

Nasdaq, S&P remain under pressure

A.R Chowdhury by A.R Chowdhury
September 17, 2021
Reading Time: 1 min read
0
Nasdaq, S&P remain under pressure

The 200 hour MA is breached in the Nasdaq but can’t reached the week low

The NASDAQ and S&P remain under the most pressure today.

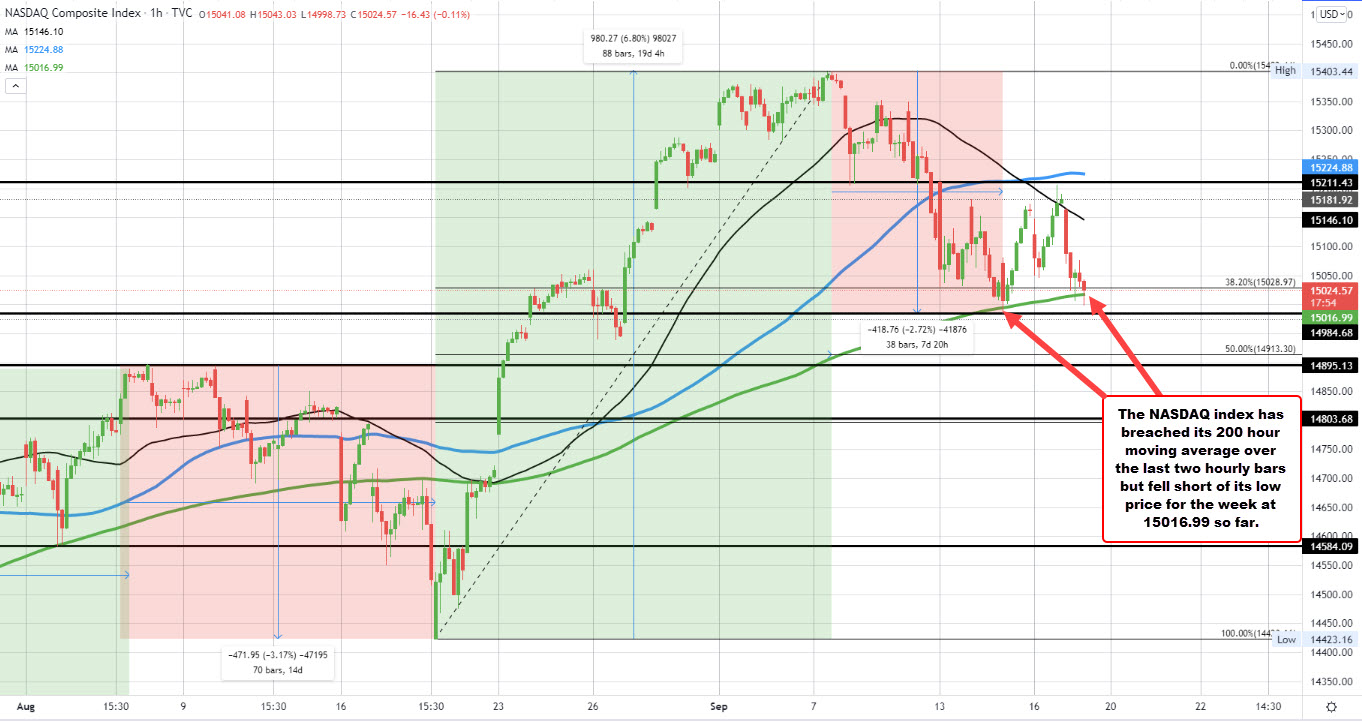
The NASDAQ index is currently down -1.1% at 15014.01.

The S&P index is down -41.61 points or -0.93% at 4432.02.

Looking at the NASDAQ index (see hourly chart above), it did reach below its 200 hour moving average at 15016.99. The price is just below that level now. The low for the day at 14998.73 could not reach the low from earlier in the week at 14984.68 (at least yet).  If the price can stay below the 200 hour moving average, however, the sellers remain in control.  A move below the low for the week would have traders looking toward the 50% retracement ultimately at 14913.30.

For the S&P index it has moved to a new low for the week reaching 4427.93. That low stalled just ahead of the 38.2% retracement of the move up from the August 19 low at 4426.39. The price of the S&P is already below its 200 hour moving average which is up at 4477.50.  This week, the swing highs found resistance near the 4479.72 level. That level in addition to the 200 hour moving average will be resistance levels on any bounce back rally. A move above each would increase the bullish bias.

Source link

RELATED POSTS

EURGBP erases gains and returns to a familiar bias defining level

New highs for US stocks. The Nasdaq continues to lead

USDJPY has 3 key technical levels that have stalled the rally higher today

ShareTweetPin
A.R Chowdhury

A.R Chowdhury

Related Posts

EURGBP erases gains and returns to a familiar bias defining level
ANALYSIS

EURGBP erases gains and returns to a familiar bias defining level

August 14, 2022
New highs for US stocks. The Nasdaq continues to lead
ANALYSIS

New highs for US stocks. The Nasdaq continues to lead

August 14, 2022
USDJPY has 3 key technical levels that have stalled the rally higher today
ANALYSIS

USDJPY has 3 key technical levels that have stalled the rally higher today

August 14, 2022
WTI crude oil futures settle at $92.09
ANALYSIS

WTI crude oil futures settle at $92.09

August 14, 2022
Bitcoin technical analysis, bulls might be giving up soon
ANALYSIS

Bitcoin technical analysis, bulls might be giving up soon

August 14, 2022
The weekend forex technical report for the week of August 15, 2022
ANALYSIS

The weekend forex technical report for the week of August 15, 2022

August 14, 2022
Next Post
USDCAD trades to new week highs

USDCAD trades to new week highs

And just like that the NASDAQ index is down 100 points

And just like that the NASDAQ index is down 100 points

Leave a Reply Cancel reply

Your email address will not be published. Required fields are marked *

Recommended Stories

Major indices close higher with the NASDAQ index leading the way

April 4, 2022

EURUSD lower on the day. Digesting the jobs report.

April 4, 2020
US stocks close near highs

US stocks close near highs

September 15, 2021

Popular Stories

  • The USD is the strongest and the NZD is the weakest as the NA session begins

    0 shares
    Share 0 Tweet 0
  • New highs for US stocks. The Nasdaq continues to lead

    0 shares
    Share 0 Tweet 0
  • EURGBP erases gains and returns to a familiar bias defining level

    0 shares
    Share 0 Tweet 0
  • What is forex and How does it work?

    0 shares
    Share 0 Tweet 0
  • What is CFD trading?

    0 shares
    Share 0 Tweet 0
Forex Review Online

© 2022 My Forex Review - Designed with Jnews Theme.

Navigate Site

  • Home
  • Crypto
  • Education
  • News

Follow Us

No Result
View All Result
  • Home
  • Crypto
  • Education
  • News

© 2022 My Forex Review - Designed with Jnews Theme.