Forex Review Online
No Result
View All Result
  • Home
  • Crypto
  • Education
  • News
start trading today
  • Home
  • Crypto
  • Education
  • News
No Result
View All Result
Forex Review Online
No Result
View All Result
Home ANALYSIS

GBPUSD trade between swing area on the daily chart

A.R Chowdhury by A.R Chowdhury
March 9, 2022
Reading Time: 5 mins read
0
GBPUSD trade between swing area on the daily chart

GBPUSD

GBPUSD trades back within the swing area on the daily chart

The technical story on the  GBPUSD 
GBP/USD

The GBP/USD is the currency pair encompassing the United Kingdom’s currency, the British pound sterling (symbol £, code GBP), and the dollar of the United States of America (symbol $, code USD). The pair’s rate indicates how many US dollars are needed in order to purchase one British pound. For example, when the GBP/USD is trading at 1.5000, it means 1 pound is equivalent to 1.5 dollars. The GBP/USD is the fourth most traded currency pair on the forex exchange market, giving it ample liquidity and a low spread. Whilst the spreads of currency pairs vary from broker to broker, generally speaking, the GBP/USD often stays within the 1 pip to 3 pip spread range, making it a decent candidate for scalping. The GBP/USD pair, also informally known as “cable” (due to transatlantic cables being used to transmit its exchange rate via telegraph back in the 19th century) has a positive correlation with the EUR/USD, and a negative correlation with the USD/CHF. Trading the GBP/USDWhilst a lot of traders and even brokers will assert that the best time to trade the GBP/USD is during its most active hours during London and New York, doing so can be a double-edged sword due to the often-unpredictable nature of the pair. Its volatility also fluctuates often, and so what could be a profitable looking strategy one month, may not be so productive in later months. In addition, purely technical traders can really struggle to be consistent with this pair, (i.e. by ignoring fundamentals), due to the unique political nature of the United Kingdom. The recent drama surrounding Brexit has added another layer of uncertainty to this currency pair. With a smooth resolution not in the cards for the foreseeable future, it is clear the GBP/USD will be influenced by any developments and negotiations with the European Union.

The GBP/USD is the currency pair encompassing the United Kingdom’s currency, the British pound sterling (symbol £, code GBP), and the dollar of the United States of America (symbol $, code USD). The pair’s rate indicates how many US dollars are needed in order to purchase one British pound. For example, when the GBP/USD is trading at 1.5000, it means 1 pound is equivalent to 1.5 dollars. The GBP/USD is the fourth most traded currency pair on the forex exchange market, giving it ample liquidity and a low spread. Whilst the spreads of currency pairs vary from broker to broker, generally speaking, the GBP/USD often stays within the 1 pip to 3 pip spread range, making it a decent candidate for scalping. The GBP/USD pair, also informally known as “cable” (due to transatlantic cables being used to transmit its exchange rate via telegraph back in the 19th century) has a positive correlation with the EUR/USD, and a negative correlation with the USD/CHF. Trading the GBP/USDWhilst a lot of traders and even brokers will assert that the best time to trade the GBP/USD is during its most active hours during London and New York, doing so can be a double-edged sword due to the often-unpredictable nature of the pair. Its volatility also fluctuates often, and so what could be a profitable looking strategy one month, may not be so productive in later months. In addition, purely technical traders can really struggle to be consistent with this pair, (i.e. by ignoring fundamentals), due to the unique political nature of the United Kingdom. The recent drama surrounding Brexit has added another layer of uncertainty to this currency pair. With a smooth resolution not in the cards for the foreseeable future, it is clear the GBP/USD will be influenced by any developments and negotiations with the European Union.
Read this Term
is shifting a little more with the buyers trying to take back some control.

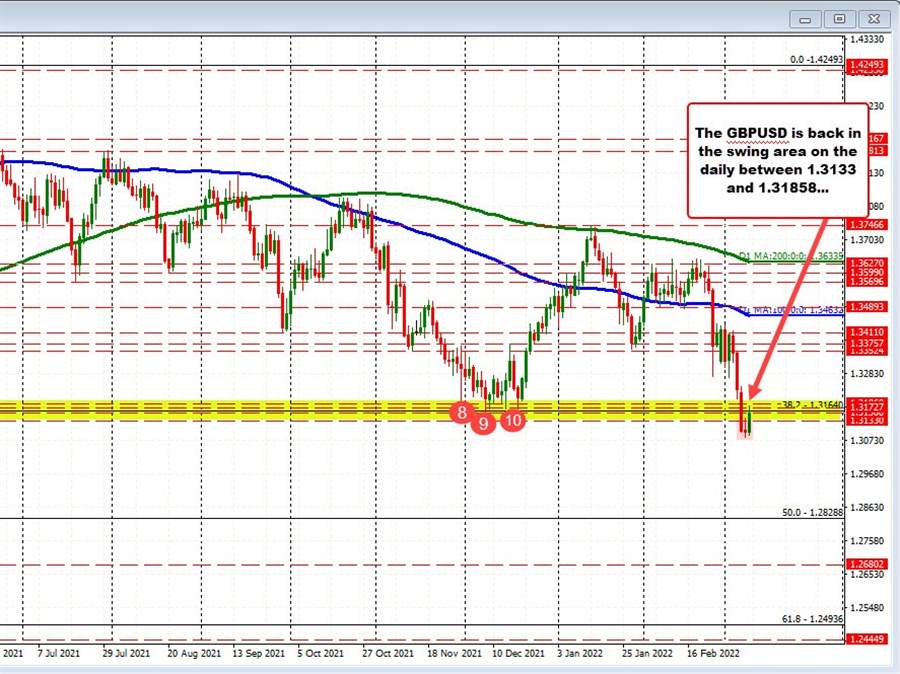
Recall from yesterday (see post here), the pair fell below a swing area between 1.3133 and 1.31858. The price closed below that swing area for two days, but has returned back into that area on the corrective move higher today.

RELATED POSTS

EURGBP erases gains and returns to a familiar bias defining level

New highs for US stocks. The Nasdaq continues to lead

USDJPY has 3 key technical levels that have stalled the rally higher today

So far, however, the price has remained below the upper extreme (at 1.31858). The high price has reach 1.31799.

The good news for the dip buyers is that the low price off of that high has also remained above the lower extreme at 1.3133. The low price reached 1.31362 and has bounced modestly to the current level 1.3168.

So the price is within its own traders purgatory with buyers and sellers battling it out within the daily swing area.

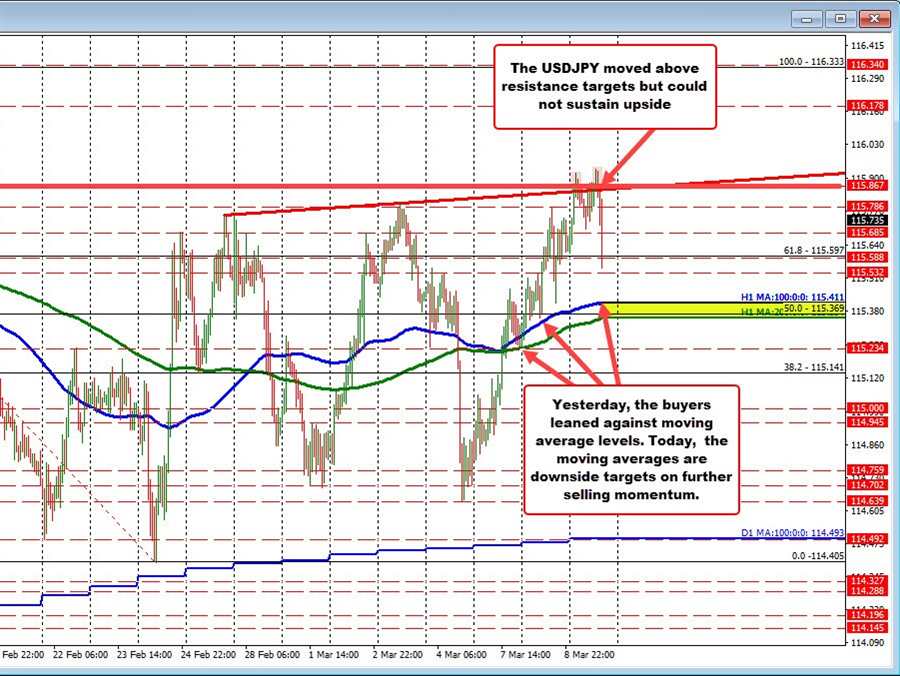
Drilling to the hourly chart below, should the price move above 1.31858, it would next have to extend above the falling 100 hour moving average at 1.31961.

The price last traded above that 100 hour moving average on Thursday of last week, but the attempt to extend above that level ultimately gave way.

That break back below the moving average on Thursday has led to the four day’s of declines into today. That move saw the price move from the 100 hour MA level at 1.3373 level down to the low yesterday of 1.30808.

Going forward, get above the 100 hour moving average and the bias gets a little bit more bright for the buyers (as long as the price can stay above that moving average level).

GBPUSD

GBPUSD on the hourly chart
ADVERTISEMENT – CONTINUE READING BELOW

Source link

ShareTweetPin
A.R Chowdhury

A.R Chowdhury

Related Posts

EURGBP erases gains and returns to a familiar bias defining level
ANALYSIS

EURGBP erases gains and returns to a familiar bias defining level

August 14, 2022
New highs for US stocks. The Nasdaq continues to lead
ANALYSIS

New highs for US stocks. The Nasdaq continues to lead

August 14, 2022
USDJPY has 3 key technical levels that have stalled the rally higher today
ANALYSIS

USDJPY has 3 key technical levels that have stalled the rally higher today

August 14, 2022
WTI crude oil futures settle at $92.09
ANALYSIS

WTI crude oil futures settle at $92.09

August 14, 2022
Bitcoin technical analysis, bulls might be giving up soon
ANALYSIS

Bitcoin technical analysis, bulls might be giving up soon

August 14, 2022
The weekend forex technical report for the week of August 15, 2022
ANALYSIS

The weekend forex technical report for the week of August 15, 2022

August 14, 2022
Next Post
USDJPY succumbs to the dollar selling

USDJPY succumbs to the dollar selling

NASDAQ index leads the way higher for the major indices

NASDAQ index leads the way higher for the major indices

Leave a Reply Cancel reply

Your email address will not be published. Required fields are marked *

Recommended Stories

NASDAQ close is at a new record

August 3, 2020

GBPUSD moves back toward 100 hour MA

August 14, 2021

GBPUSD trades to new session lows

May 12, 2020

Popular Stories

  • The USD is the strongest and the NZD is the weakest as the NA session begins

    0 shares
    Share 0 Tweet 0
  • New highs for US stocks. The Nasdaq continues to lead

    0 shares
    Share 0 Tweet 0
  • EURGBP erases gains and returns to a familiar bias defining level

    0 shares
    Share 0 Tweet 0
  • What is forex and How does it work?

    0 shares
    Share 0 Tweet 0
  • What is CFD trading?

    0 shares
    Share 0 Tweet 0
Forex Review Online

© 2022 My Forex Review - Designed with Jnews Theme.

Navigate Site

  • Home
  • Crypto
  • Education
  • News

Follow Us

No Result
View All Result
  • Home
  • Crypto
  • Education
  • News

© 2022 My Forex Review - Designed with Jnews Theme.