38.2% and the 200 hour MA resistance above at 1.3747. The 100 hour moving average at 1.36827 is the lower support
The GBPUSD is trading up and down today and trades near the middle of the range.
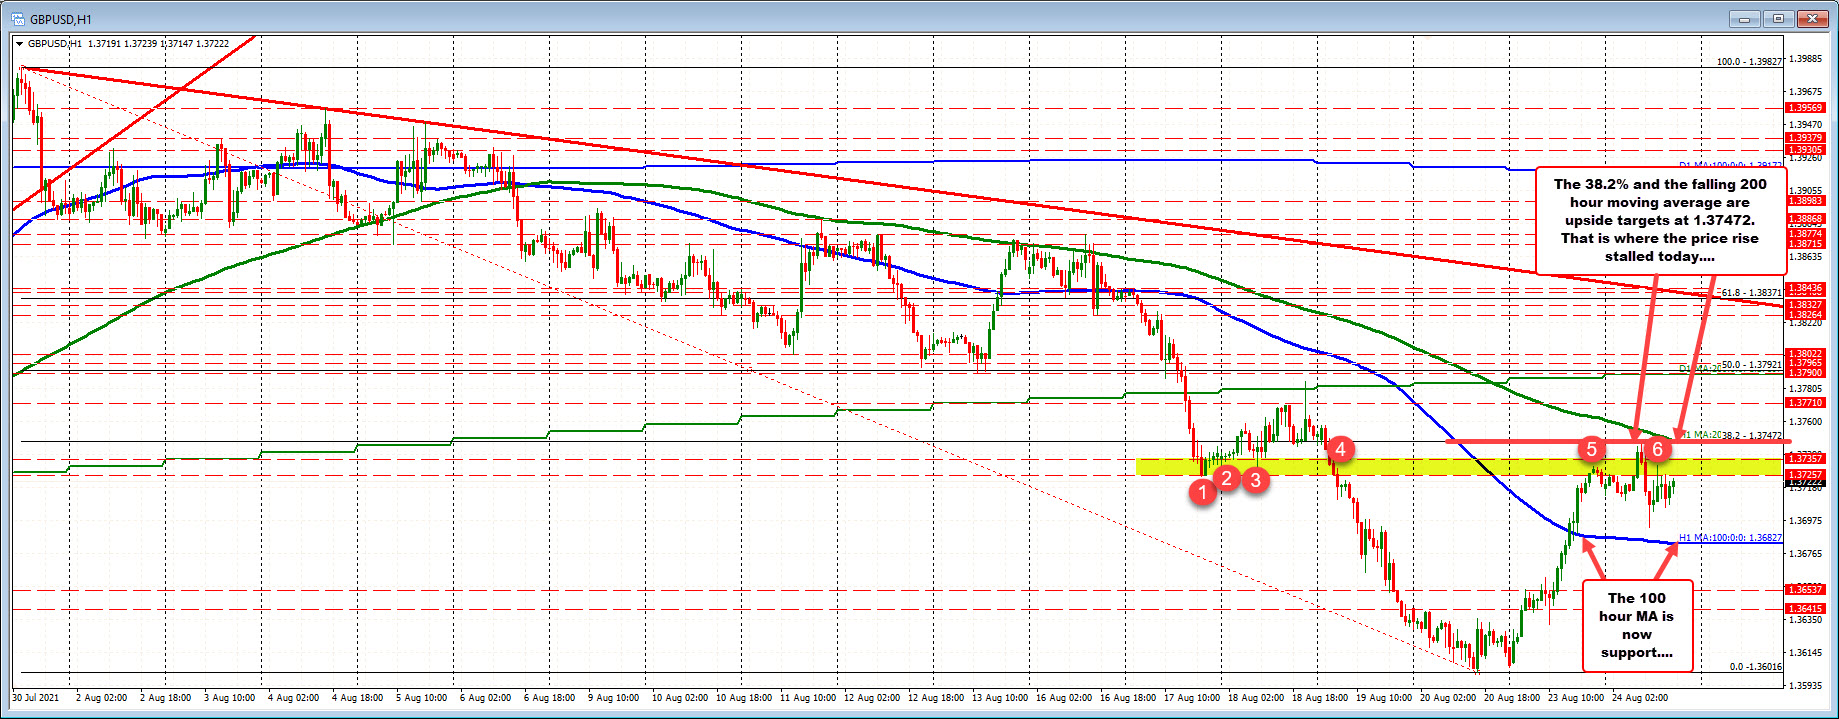
The high prices reach 1.37471. That high corresponded with the 38.2% retracement of the move down from the July 30 high.
The low price today reached 1.36928. That came up short of its 100 hour moving average (blue line) at 1.36827. Yesterday the price moved back above the 100 hour moving average for the first time since August 16.
With the price in between the moving averages, the buyers neutralized the bias somewhat. However, if the price is to continue higher, it still needs to get and stay above the 200 hour moving average and 38.2% retracement of the last trend like move to the downside. Absent that and the correction is simply a plain-vanilla variety.
Ahead of the aforementioned extremes, watch the 1.37257 to 1.37357 swing area (see red numbered circles in yellow area) for intraday clues. If the price can extend above that level and stay above that would be more positive. If sellers to lean in the area ahead of the 38.2% and 200 hour moving average, it tells me that sellers are trying to put a lid on the pair’s rise.