Forex Review Online
No Result
View All Result
  • Home
  • Crypto
  • Education
  • News
start trading today
  • Home
  • Crypto
  • Education
  • News
No Result
View All Result
Forex Review Online
No Result
View All Result
Home ANALYSIS

GBPUSD breaks back below the 38.2% retracement on the hourly chart. Extends the narrow trading range

A.R Chowdhury by A.R Chowdhury
August 31, 2021
Reading Time: 2 mins read
0

Back down testing its 100 hour moving average

The GBPUSD just extended the trading range for the day and in the process moved back below its 38.2% retracement of the move down from the July 30 high. 

That level comes in at 1.37472. The European session low stalled right around that level and moved up into the early New York trading, but the price has just reversed lower and extends down to the 100 hour moving average (blue line in the chart below).

Back down testing its 100 hour moving average_

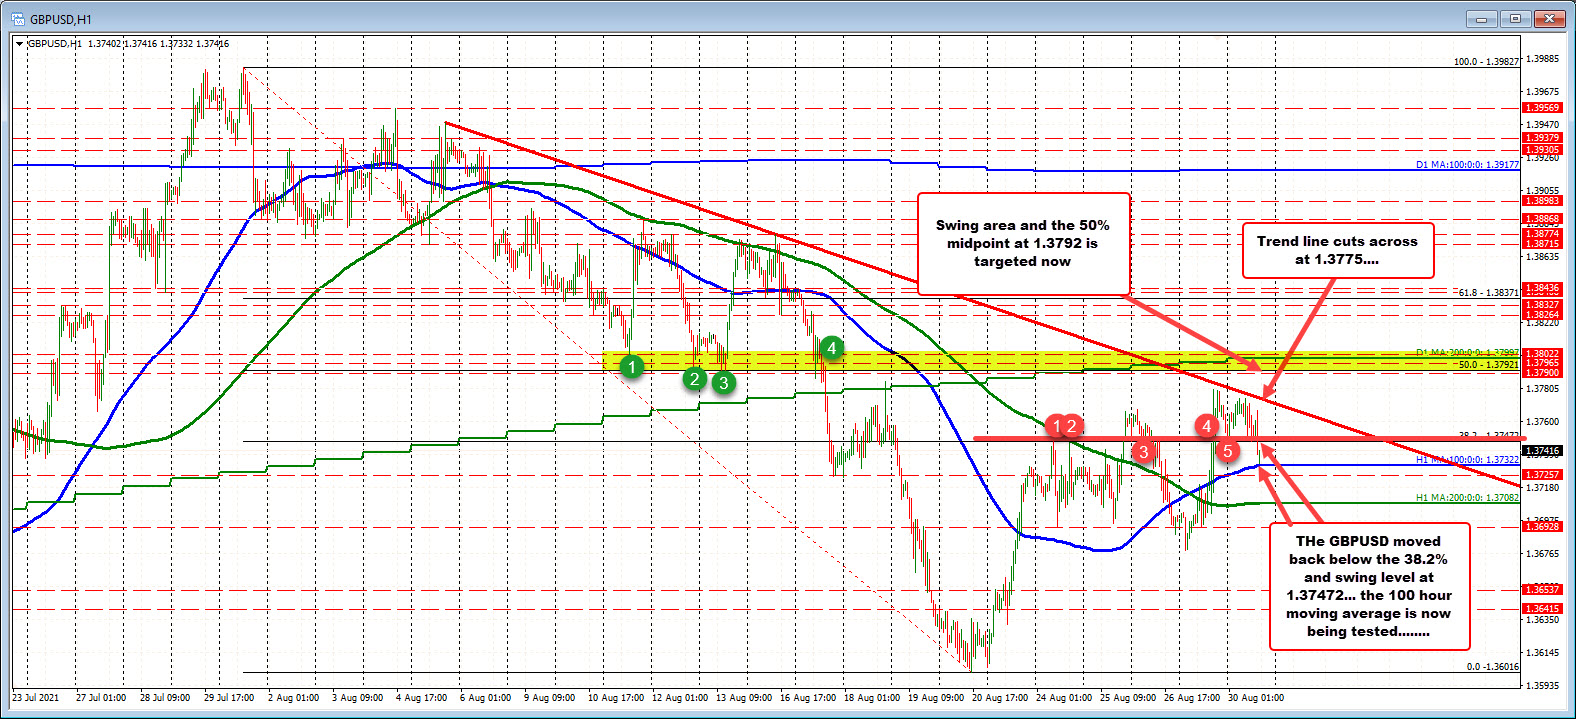
The range today’s was only 29 pips a few minutes ago, but has extended to 41 pips with the recent move to the downside. 

It is a UK holiday which limits trading activity. Nevertheless breaking the support at the 38.2% retracement gives the sellers a little more of a intraday edge at least in the short term. Having said that, there is still more work to do if the sellers are to take even more control today. 

Getting below the 100 hour moving average (blue line at 1.37322) followed by the 200 hour moving average (at 1.37082 green line), are the next steps for additional bearish momentum. 

Conversely, hold the 100 hour moving average and get back above the 38.2% retracement at 1.37472 would disappoint the sellers from the break lower.

On a move back higher (and back above the 38.2% retracement), the next target level comes in against a downward sloping trendline which cuts across currently at 1.3775. Above that is the 50% retracement 1.37921 and a swing area between 1.3790 and 1.3802. The 200 day moving average is also within that area at 1.37998 (see yellow area in the chart above). Needless to say, getting back above all those levels is really what needs to be done if the buyers are to take more control away from the sellers.

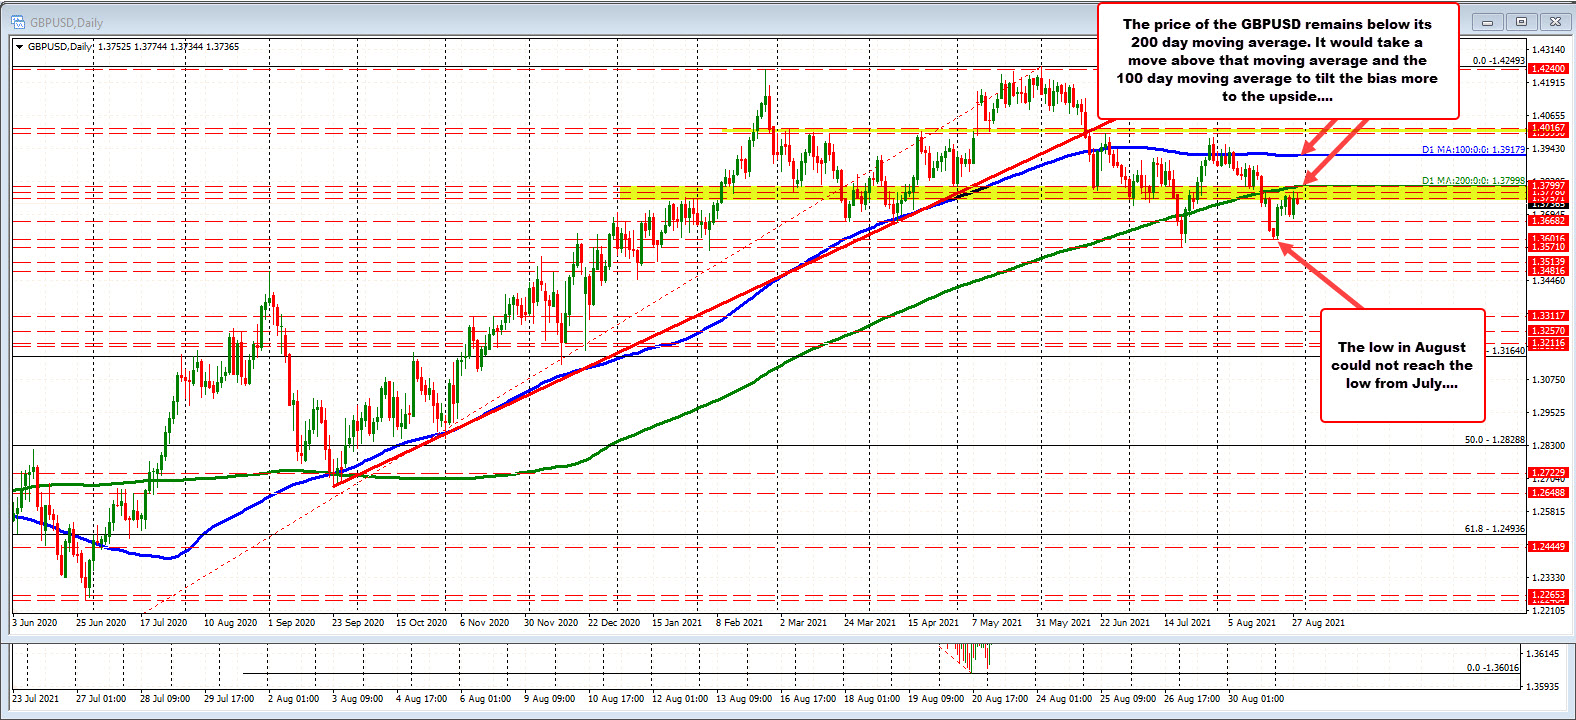
Taking a broader look at the daily chart below, as mentioned above, the price for the  GBPUSD still remains below the 200 day moving average (green line in the chart below). The 100 day moving average is also higher 1.39179 (blue line in the chart below). The low for the month of August stalled ahead of the low for the year from July (at 1.3571). The August low reached 1.36016 before rebounding.

Ultimately the 200 day moving average will be a key barometer for the pair in the short term and as we head toward the end of the year. If the price can not extend back above the 200 day moving average, there is a good chance traders take out the lows for the year and extend the trading range.  Conversely get back above the 200 day moving average and it opens the door for further upside potential.

GBPUSD on the daily chart
Invest in yourself. See our forex education hub.

Source link

RELATED POSTS

EURGBP erases gains and returns to a familiar bias defining level

New highs for US stocks. The Nasdaq continues to lead

USDJPY has 3 key technical levels that have stalled the rally higher today

ShareTweetPin
A.R Chowdhury

A.R Chowdhury

Related Posts

EURGBP erases gains and returns to a familiar bias defining level
ANALYSIS

EURGBP erases gains and returns to a familiar bias defining level

August 14, 2022
New highs for US stocks. The Nasdaq continues to lead
ANALYSIS

New highs for US stocks. The Nasdaq continues to lead

August 14, 2022
USDJPY has 3 key technical levels that have stalled the rally higher today
ANALYSIS

USDJPY has 3 key technical levels that have stalled the rally higher today

August 14, 2022
WTI crude oil futures settle at $92.09
ANALYSIS

WTI crude oil futures settle at $92.09

August 14, 2022
Bitcoin technical analysis, bulls might be giving up soon
ANALYSIS

Bitcoin technical analysis, bulls might be giving up soon

August 14, 2022
The weekend forex technical report for the week of August 15, 2022
ANALYSIS

The weekend forex technical report for the week of August 15, 2022

August 14, 2022
Next Post

EURUSD stays above 50% midpoint of recent trading range

EUR/USD up to highest in over three weeks ahead of European trading

Leave a Reply Cancel reply

Your email address will not be published. Required fields are marked *

Recommended Stories

The GBP is the strongest and the NZD is the weakest as NA traders enter for the day

August 14, 2020
This is gold’s best chance to break a key level

This is gold’s best chance to break a key level

September 3, 2021

NASDAQ is giving up some of their gains

July 7, 2020

Popular Stories

  • The USD is the strongest and the NZD is the weakest as the NA session begins

    0 shares
    Share 0 Tweet 0
  • EURGBP erases gains and returns to a familiar bias defining level

    0 shares
    Share 0 Tweet 0
  • New highs for US stocks. The Nasdaq continues to lead

    0 shares
    Share 0 Tweet 0
  • What is forex and How does it work?

    0 shares
    Share 0 Tweet 0
  • What is CFD trading?

    0 shares
    Share 0 Tweet 0
Forex Review Online

© 2022 My Forex Review - Designed with Jnews Theme.

Navigate Site

  • Home
  • Crypto
  • Education
  • News

Follow Us

No Result
View All Result
  • Home
  • Crypto
  • Education
  • News

© 2022 My Forex Review - Designed with Jnews Theme.