16 pip range on Thursday at the start of the session has since moved some 212 pips
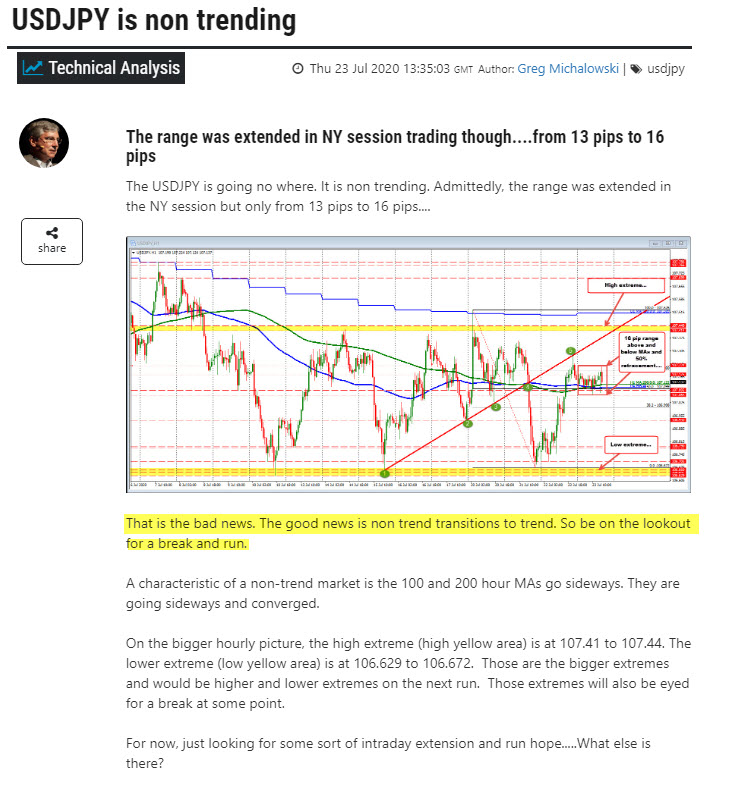
Recall from Thursday when I spoke of the Non-trend in the USDJPY. The pair was in a 16 pip trading range. That was the bad news. The good news was non-trend transitions to trend. Here is that post.
Since that time, the price indeed has trended lower. Below is the 5 minutes chart outlining the decline. Along the way I break down the trend move by the trend legs.
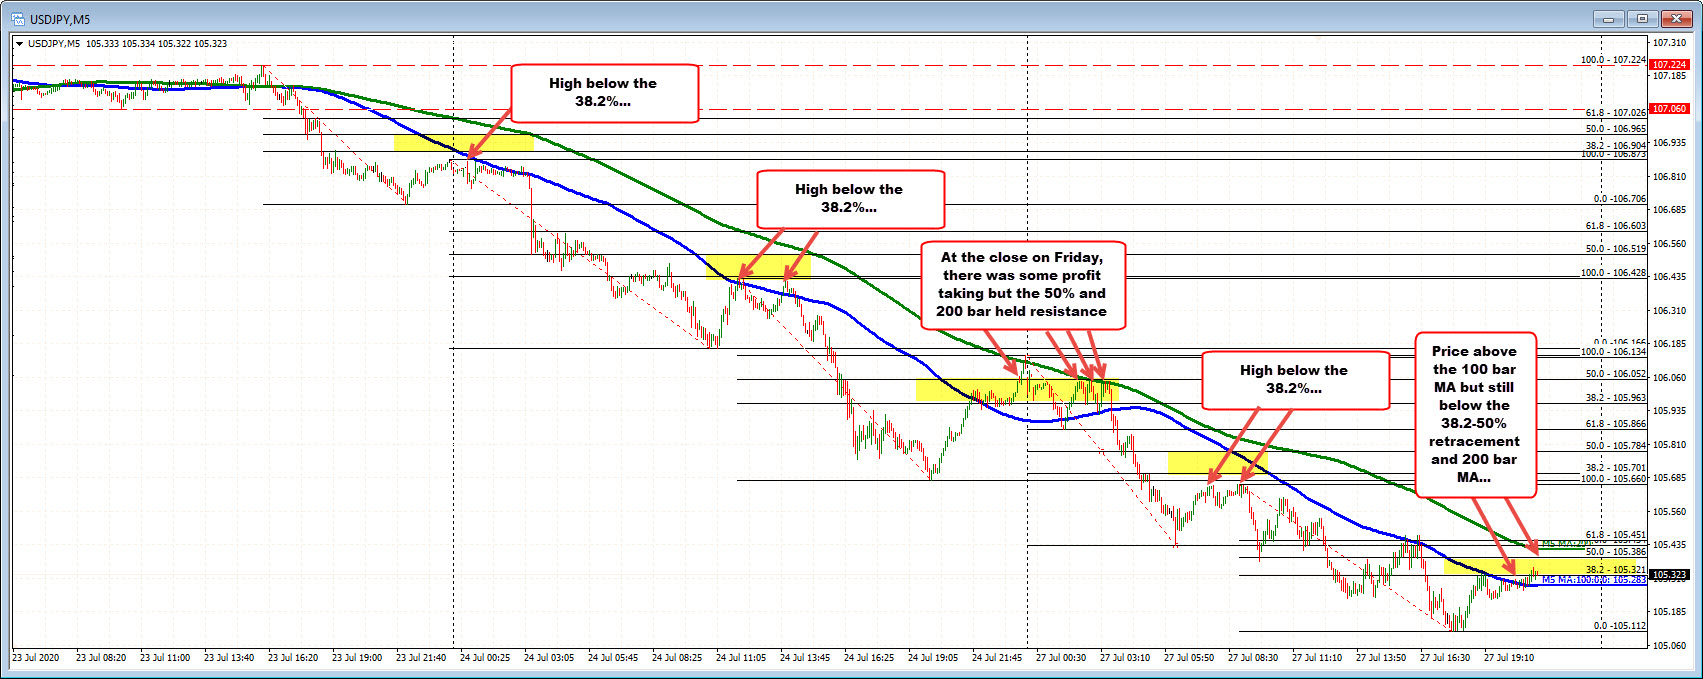
Trends move lower and correct. Move lower and correct. If the trend is strong, the corrections tend to find sellers in the 38.2-50% of the recent leg. If the price can stay below that “Correction Zone” the trend move remains strong. The yellow areas in the chart below outline those Correction Zones.
There have been 5 trend moves lower. Only on Friday, has the correction of the leg moved above the 50%. That was into the close for the week. So there was likely some profit taking into the weekend. However, today, the high price in the early hour of trading stalled against the 50%.
Looking at the 100 and 200 bar MAs, there was only a small peek above the 200 bar MA and that was on Friday into the close. Most of the bar were below the 100 bar MA (the blue line).
There is some concern now, however. The price has moved above the 100 bar MA at 105.283. It still remains below the 38.2-50% retracement at 105.32-386 and the falling 200 bar MA at 105.414. A move above each, could see sellers turn to buyers and probe more to the upside. Note it is not the end of the world, but it does give buyers a small victory in what has been a steady stream of losses over the last few days.


