100 hour moving average currently comes in at 3083.82
The S&P index on the hourly chart, gapped below its 50 hour moving average (white line in the chart below) at 3159.72 and has moved to a low of 3098.67. We currently trade just above that low at 3102.
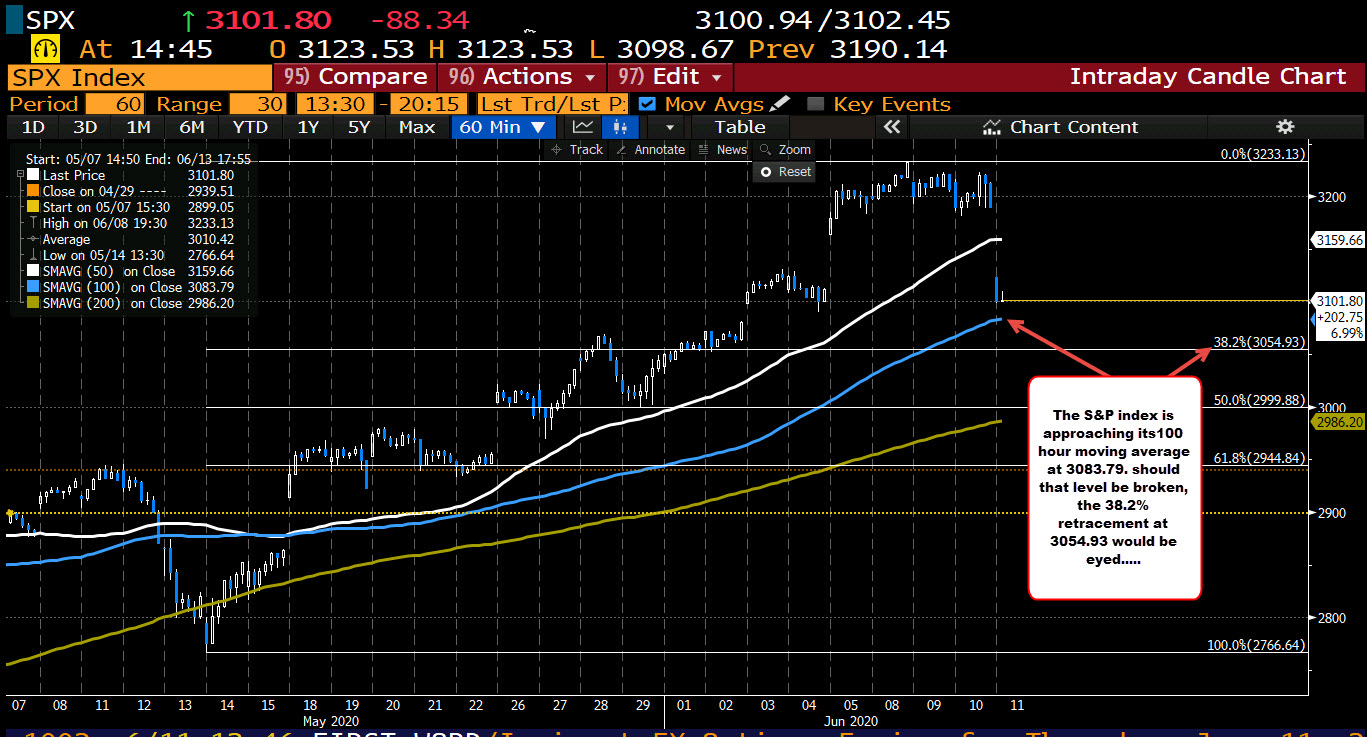
On the downside, the pair is getting closer to its rising 100 hour moving average at 3083.80. The price has been above that moving average since May 15. A move back below would have traders looking toward the 38.2% retracement of the move up from the May 14 low at 3054.93.