Forex Review Online
No Result
View All Result
  • Home
  • Crypto
  • Education
  • News
start trading today
  • Home
  • Crypto
  • Education
  • News
No Result
View All Result
Forex Review Online
No Result
View All Result
Home ANALYSIS

Nasdaq index moves closer to 100/200 day MAs

A.R Chowdhury by A.R Chowdhury
March 29, 2022
Reading Time: 4 mins read
0

NASDAQ index

NASDAQ index approaches its 100 day moving average

RELATED POSTS

EURGBP erases gains and returns to a familiar bias defining level

New highs for US stocks. The Nasdaq continues to lead

USDJPY has 3 key technical levels that have stalled the rally higher today

The  Nasdaq 
NASDAQ

The Nasdaq Stock Market or NASDAQ is an American stock exchange. It trails only the New York Stock Exchange (NYSE) in market capitalization and is part of a network of stock markets and options exchanges.Launched back in 1971, NASDAQ is the acronym for the National Association of Securities Dealers Automated Quotations. Since then it is known simply as NASDAQ and has become one of the most influential exchanges worldwide.The NASDAQ was the world’s first electronic stock market, and has since assumed the majority of major trades that had been executed by the over-the-counter (OTC) system of trading.What Makes Up the NASDAQ?In particular, the exchange also features the NASDAQ Composite, which includes almost all stocks listed on the NASDAQ stock market. Along with the Dow Jones Industrial Average (DIJA) and S&P 500 Index, this is one of the three most-followed stock market indices in the United States.Overall, the NASDAQ stock market has three different market tiers. This includes the Capital Market, or an equity market for companies that have relatively small levels of market capitalization. The listing requirements for small cap companies are less stringent than for other Nasdaq markets that list larger companies with significantly higher market capitalization.Additionally, the Global Market is made up of stocks that represent the Nasdaq Global Market. The Global Market consists of 1,450 stocks that meet the exchange’s financial and liquidity requirements, and corporate governance standards.Finally, the Global Select Market is a market capitalization-weighted index made up of 1,200 US-based and international stocks that represent the Global Select Market Composite.

The Nasdaq Stock Market or NASDAQ is an American stock exchange. It trails only the New York Stock Exchange (NYSE) in market capitalization and is part of a network of stock markets and options exchanges.Launched back in 1971, NASDAQ is the acronym for the National Association of Securities Dealers Automated Quotations. Since then it is known simply as NASDAQ and has become one of the most influential exchanges worldwide.The NASDAQ was the world’s first electronic stock market, and has since assumed the majority of major trades that had been executed by the over-the-counter (OTC) system of trading.What Makes Up the NASDAQ?In particular, the exchange also features the NASDAQ Composite, which includes almost all stocks listed on the NASDAQ stock market. Along with the Dow Jones Industrial Average (DIJA) and S&P 500 Index, this is one of the three most-followed stock market indices in the United States.Overall, the NASDAQ stock market has three different market tiers. This includes the Capital Market, or an equity market for companies that have relatively small levels of market capitalization. The listing requirements for small cap companies are less stringent than for other Nasdaq markets that list larger companies with significantly higher market capitalization.Additionally, the Global Market is made up of stocks that represent the Nasdaq Global Market. The Global Market consists of 1,450 stocks that meet the exchange’s financial and liquidity requirements, and corporate governance standards.Finally, the Global Select Market is a market capitalization-weighted index made up of 1,200 US-based and international stocks that represent the Global Select Market Composite.
Read this Term
index is currently trading up 234 points or 1.63% at 14500. The high price reached 14591 so far. The index is working on its eight day higher in 11 trading days. Since bottoming on March 14, the index is up over 16%. The index is still 11.22% away from its all-time high reached on November 22.

Technically, the move to the upside today took the price above the 50% retracement of the move down from the November high at 14383.79. That will now be a risk level for longs looking for more upside. Stay above is more bullish.

The move higher has also taken the price above swing highs from February at 14504 area. That is a closer risk level.

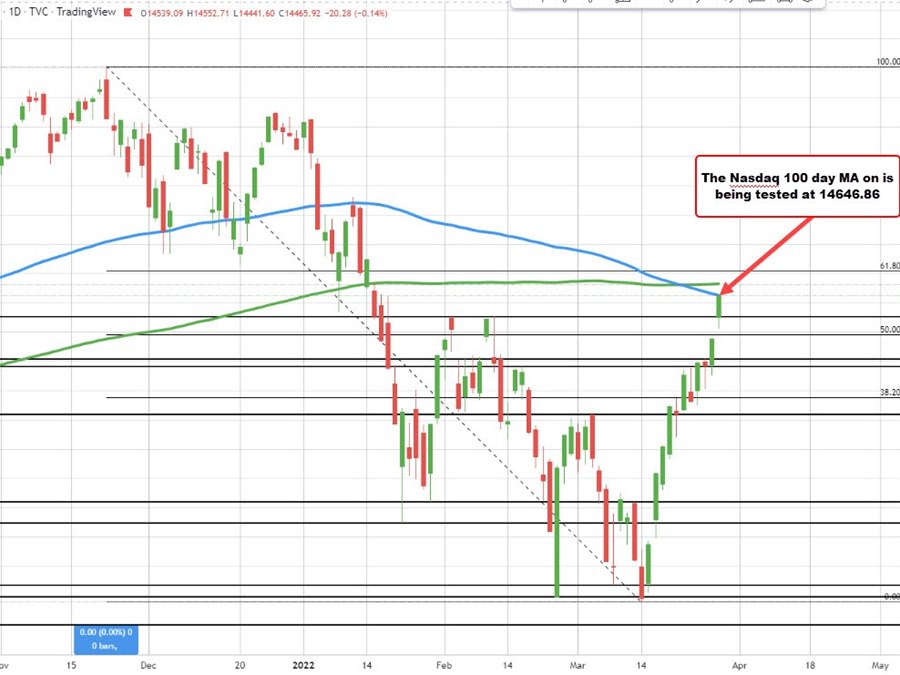
The next key targets on the topside would have the pairs moving back above the 100 and 200 day MAs. The 100 day MA currently comes in at 14648.21. The 200 day moving average is modestly above that level at 14726.65. Move above each would increase the bullish bias from a technical perspective. However, I would expect that traders give cause for pause against the levels on the first look, with stops on a break above.

ADVERTISEMENT – CONTINUE READING BELOW

Source link

ShareTweetPin
A.R Chowdhury

A.R Chowdhury

Related Posts

EURGBP erases gains and returns to a familiar bias defining level
ANALYSIS

EURGBP erases gains and returns to a familiar bias defining level

August 14, 2022
New highs for US stocks. The Nasdaq continues to lead
ANALYSIS

New highs for US stocks. The Nasdaq continues to lead

August 14, 2022
USDJPY has 3 key technical levels that have stalled the rally higher today
ANALYSIS

USDJPY has 3 key technical levels that have stalled the rally higher today

August 14, 2022
WTI crude oil futures settle at $92.09
ANALYSIS

WTI crude oil futures settle at $92.09

August 14, 2022
Bitcoin technical analysis, bulls might be giving up soon
ANALYSIS

Bitcoin technical analysis, bulls might be giving up soon

August 14, 2022
The weekend forex technical report for the week of August 15, 2022
ANALYSIS

The weekend forex technical report for the week of August 15, 2022

August 14, 2022
Next Post
The Nasdaq is testing the 100 day MA at 14646.86.

The Nasdaq is testing the 100 day MA at 14646.86.

GBPUSD bounces back higher today after the up and down day yesterday

GBPUSD bounces back higher today after the up and down day yesterday

Leave a Reply Cancel reply

Your email address will not be published. Required fields are marked *

Recommended Stories

Gold reclaims $2,000 level, climbs by 1% on the day as the dollar falters

August 18, 2020
New highs for the NZDUSD. Price runs from 200 day MA

New highs for the NZDUSD. Price runs from 200 day MA

June 2, 2020

Gold eases under $1,700 as sellers wrestle back near-term control

May 12, 2020

Popular Stories

  • New highs for US stocks. The Nasdaq continues to lead

    New highs for US stocks. The Nasdaq continues to lead

    0 shares
    Share 0 Tweet 0
  • The USD is the strongest and the NZD is the weakest as the NA session begins

    0 shares
    Share 0 Tweet 0
  • EURGBP erases gains and returns to a familiar bias defining level

    0 shares
    Share 0 Tweet 0
  • What is forex and How does it work?

    0 shares
    Share 0 Tweet 0
  • Bitcoin technical analysis, bulls might be giving up soon

    0 shares
    Share 0 Tweet 0
Forex Review Online

© 2022 My Forex Review - Designed with Jnews Theme.

Navigate Site

  • Home
  • Crypto
  • Education
  • News

Follow Us

No Result
View All Result
  • Home
  • Crypto
  • Education
  • News

© 2022 My Forex Review - Designed with Jnews Theme.