100 and 200 hour MAs eyed above
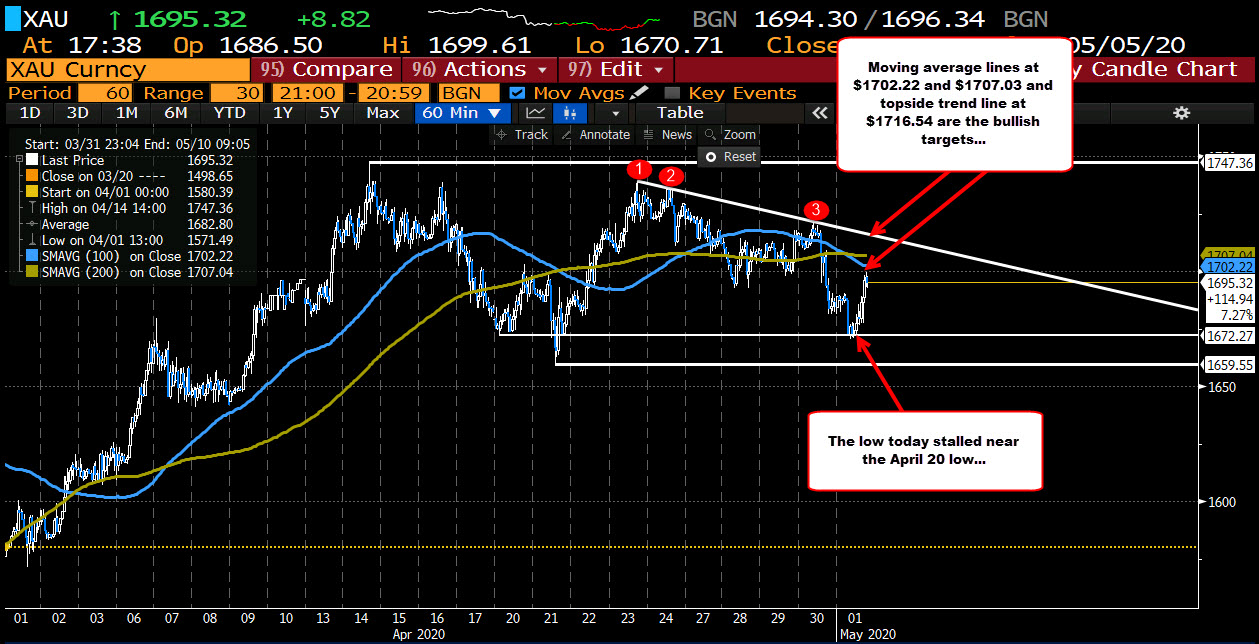
The price of gold took some time to catch a safety bid today but looking at the hourly chart below, perhaps the succesful testing of the April 21 low was a small technical catalyst.
What now?
The price has moved up to a high at $1699.61 got really close to the natural $1700 level. Just above that is the 100 hour MA at $1702.22. The 200 hour MA is above that at $1707.04. Finally a trend line cuts across at $1716.54. All those would need to be broken to the upside – and stay broken – to solicit more upside momentum and tilt the bias more to the bullish side once again.
Admittedly, the price this week has seen the price move above and below those MA levels. The market traders are unsure.
Over the coronavirus uncertainty period, the price of gold has seen safe haven flows taking the price higher. It has also seen price declines for reasons such as decreased physical demand and/or traders selling gold to pay for losses elsewhere (this was during the sharp limit down moves in April).
The story of what will happen next will be told, and the price action – and tools applied to the price action – will help to write that story. Watch the 100 and 200 hour MAs.