Trend line below at 1.2479. Swing ceiling at 1.2529-41
The GBPUSD continued to hold trend line support on the hourly chart on the correction lower today (see green numbered circles). That trend line currently comes in at 1.2479.
The pair is also moving away from its 100 day MA at 1.24478 (the 100 hour MA is also at that level currently). Those technical moves are bullish for the pair. Stay above that trend line is more bullish. The current price is trading above the the 1.2500 level at 1.2509.
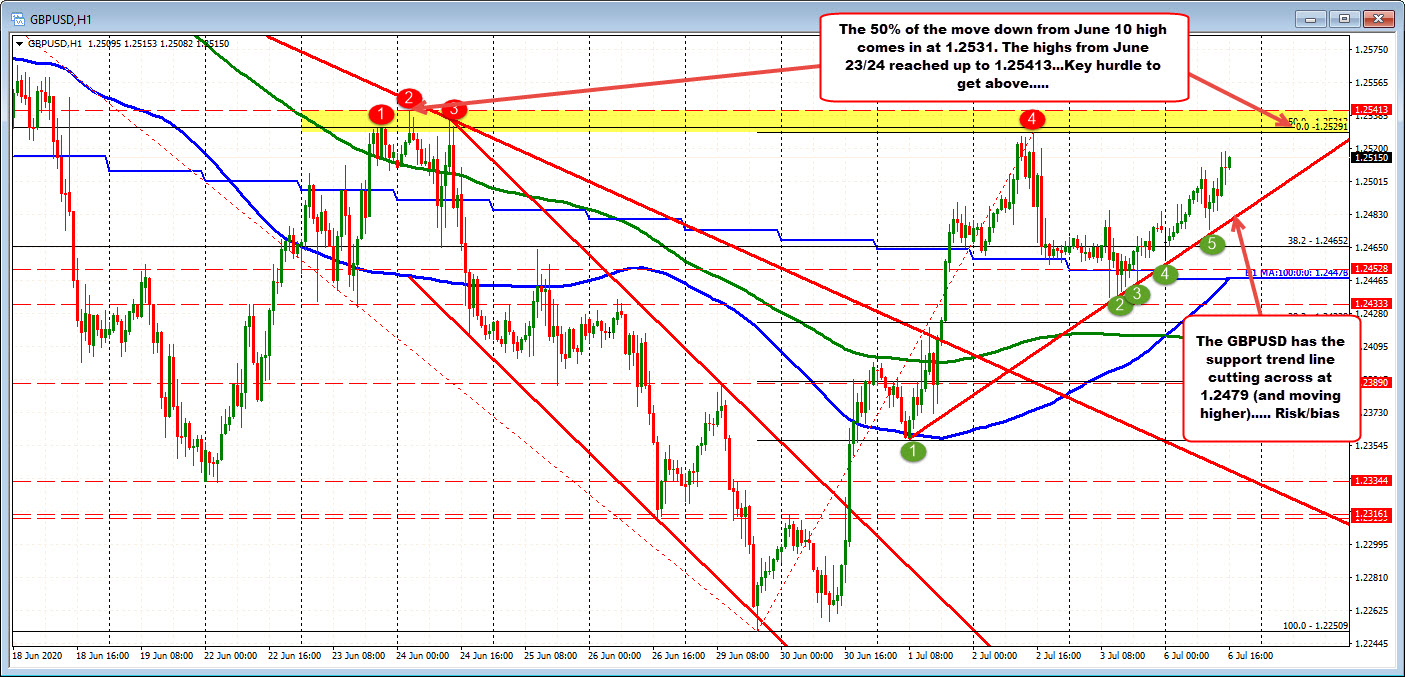
Having said that, the high from last week stalled at 1.25291. That was just short of the 50% of the move down from June 10 high (high is not shown) at 1.25313. That level. along with the swing highs from June 23/24 at the 1.2331 to 1.2541 area, will need to be broken if the buyers are to keep and extend the upside control.
For now….buyers hold the edge above the trend line on the hourly chart, but there are key upside target levels that still need to be broken.


