
2019 high price up at 1.35139. Getting through the 1.3500 level next upside target
The GBPUSD moved to the highest level since the week of December 8, 2019. During that week the high price extended up to 1.35139. The high price today reached 1.34816. Getting above the 1.3500 level and the 2019 high at 1.35139 would be the next upside targets on the weekly chart (A move above the December 2019 high would take the price to the highest level since May 2018).
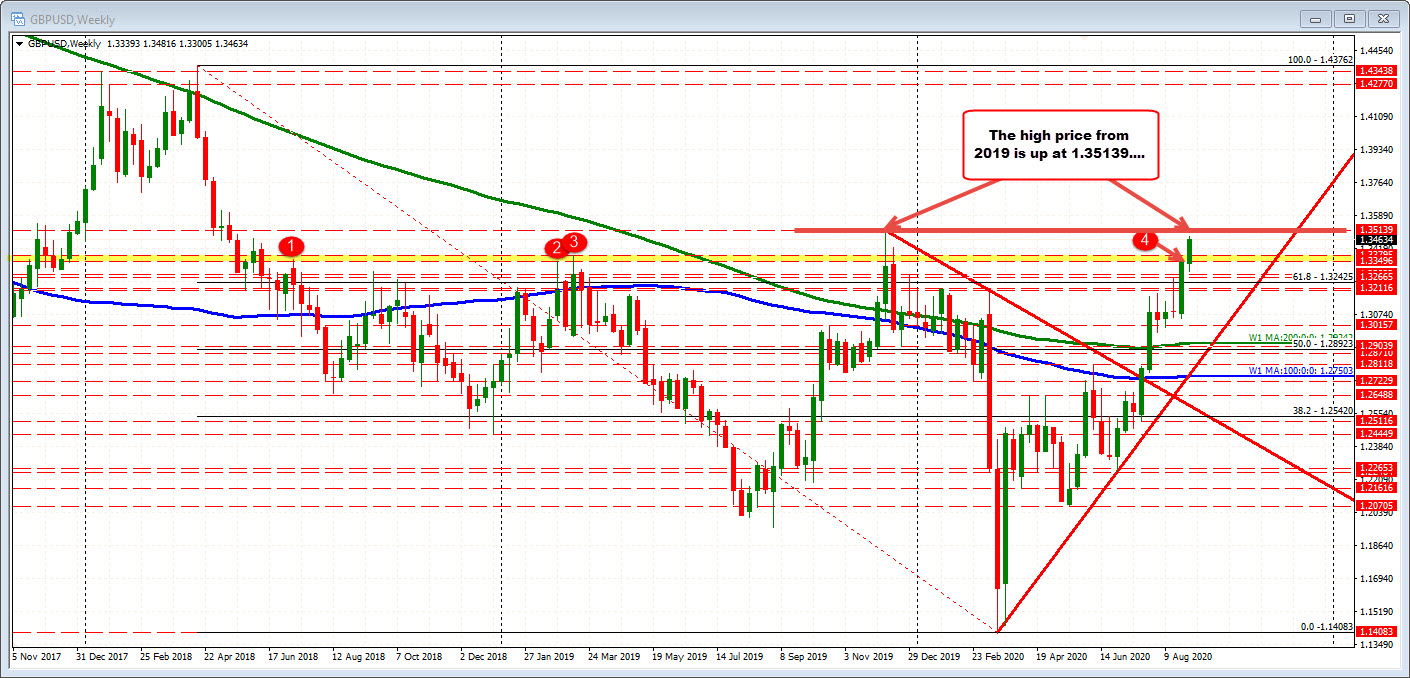
The price action this week on the weekly chart extended above swing highs in the 1.3349 to 1.33795 area (see yellow area and red numbered circles).
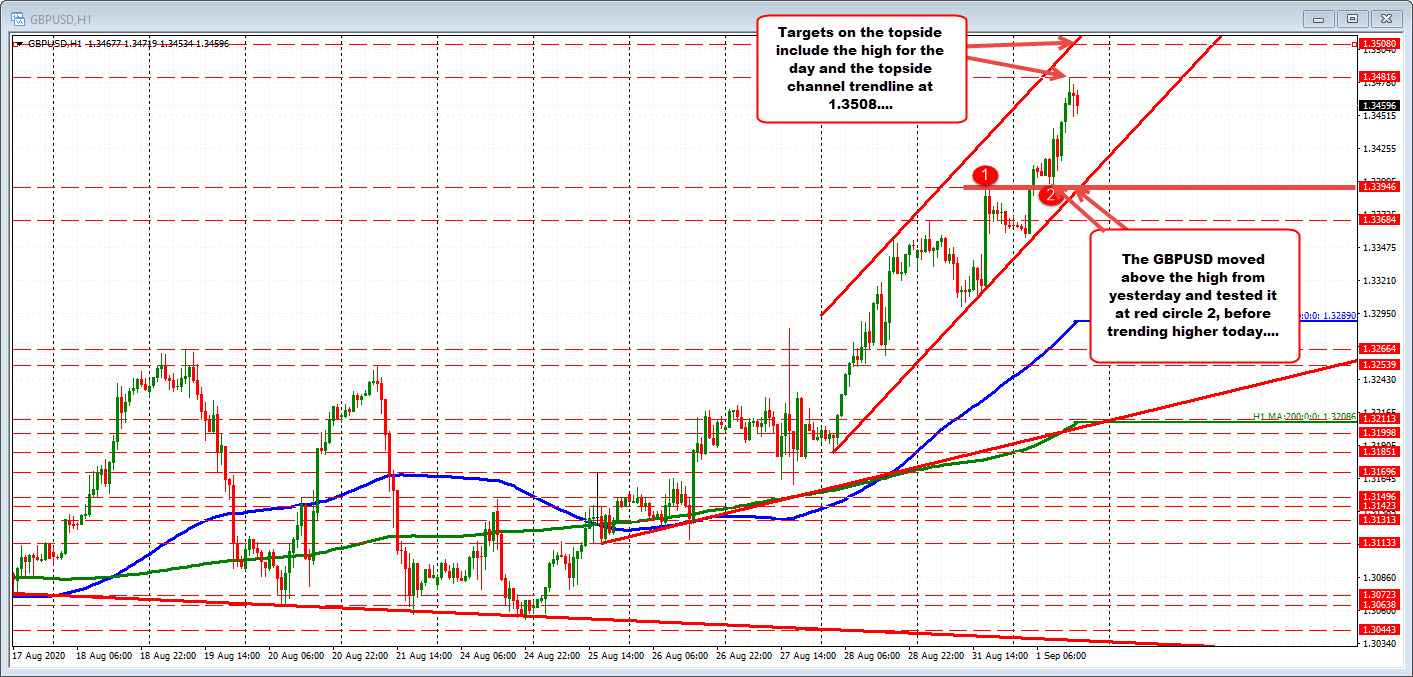
Drilling to the hourly chart, the price is trending to the upside today after breaking above and staying above the high price from yesterday at 1.33946. On more upside momentum, the 1.3500 level and 1.3508 topside channel trendline would be eyed on a break of the high for the day at 1.34816.
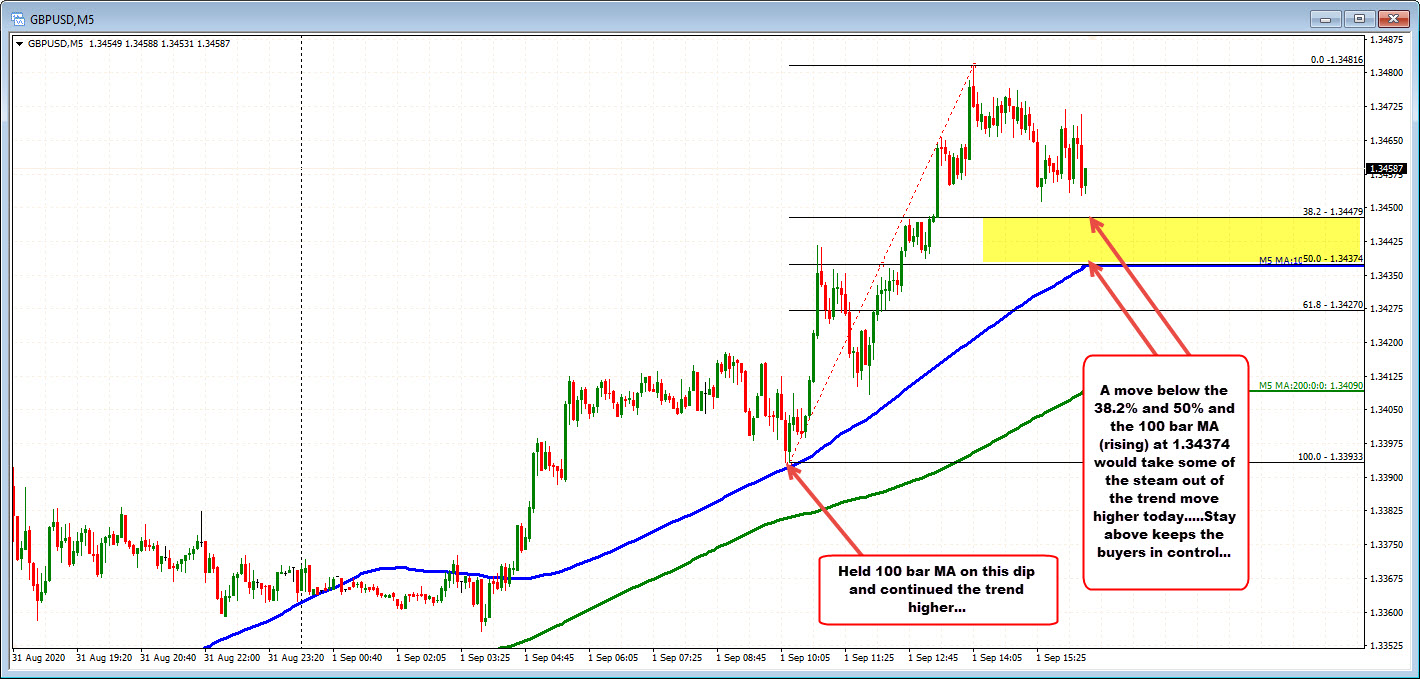
Taking one more step down to the 5 minutes chart below, the price as a trended higher. That move saw the price extend back above the 100 bar moving average (blue line in the Asian session). The corrective low in the early European session stalled right at the 100 bar moving average (blue line in the chart below) , and that moving average has not been tested since. It currently comes in at 1.34374. That is also at the 50% retracement of the last trend move higher from the 1.3393 level. Above that is the 38.2% retracement at 1.34479. So far the corrective low off the high for the day has also been able to stay above that level indicative of a plain-vanilla correction of the last trend move higher.
Buyers remain in control above that yellow area. It would take a move below to take some of the “bullishness” out of the price action today.


