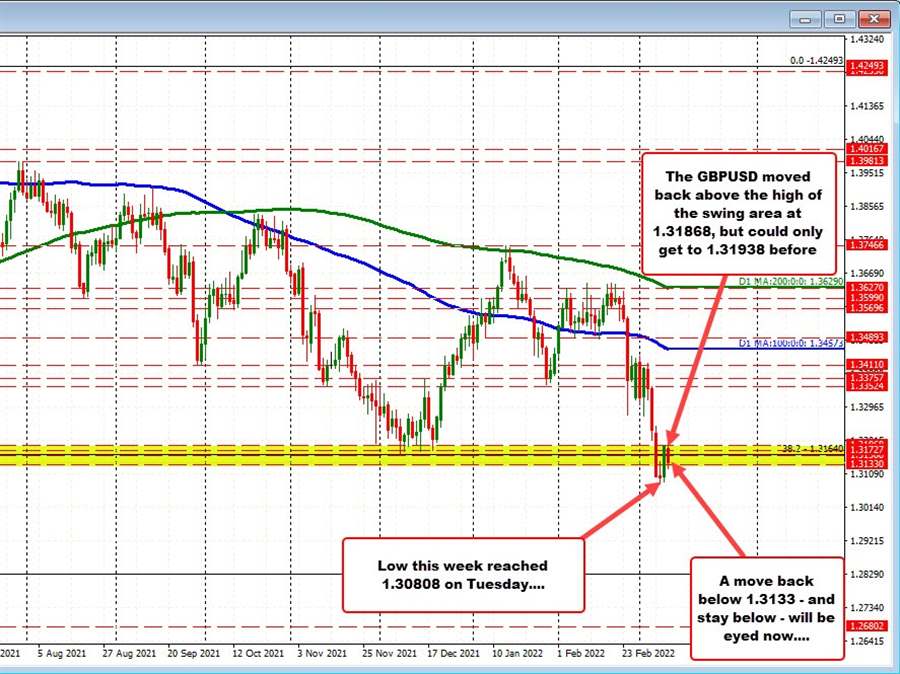
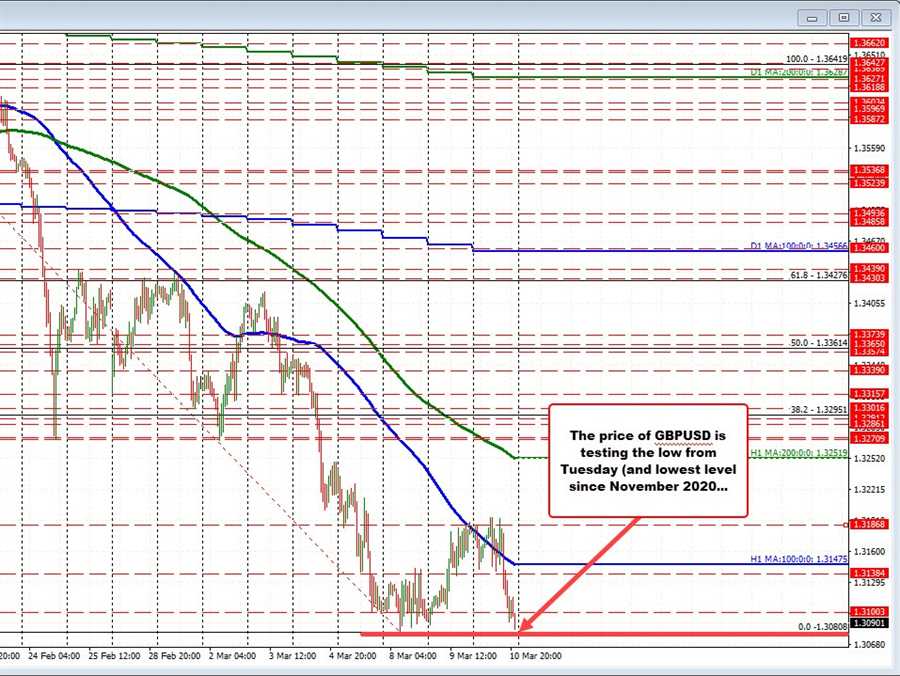
Forex Review Online
No Result
View All Result
  • Home
  • Crypto
  • Education
  • News
start trading today
  • Home
  • Crypto
  • Education
  • News
No Result
View All Result
Forex Review Online
No Result
View All Result
Home ANALYSIS

GBPUSD fails on move above high of swing area

A.R Chowdhury by A.R Chowdhury
March 10, 2022
Reading Time: 5 mins read
0
GBPUSD fails on move above high of swing area

GBPUSD

GBPUSD fails on move above the topside of the swing area

The  GBPUSD 
GBP/USD

The GBP/USD is the currency pair encompassing the United Kingdom’s currency, the British pound sterling (symbol £, code GBP), and the dollar of the United States of America (symbol $, code USD). The pair’s rate indicates how many US dollars are needed in order to purchase one British pound. For example, when the GBP/USD is trading at 1.5000, it means 1 pound is equivalent to 1.5 dollars. The GBP/USD is the fourth most traded currency pair on the forex exchange market, giving it ample liquidity and a low spread. Whilst the spreads of currency pairs vary from broker to broker, generally speaking, the GBP/USD often stays within the 1 pip to 3 pip spread range, making it a decent candidate for scalping. The GBP/USD pair, also informally known as “cable” (due to transatlantic cables being used to transmit its exchange rate via telegraph back in the 19th century) has a positive correlation with the EUR/USD, and a negative correlation with the USD/CHF. Trading the GBP/USDWhilst a lot of traders and even brokers will assert that the best time to trade the GBP/USD is during its most active hours during London and New York, doing so can be a double-edged sword due to the often-unpredictable nature of the pair. Its volatility also fluctuates often, and so what could be a profitable looking strategy one month, may not be so productive in later months. In addition, purely technical traders can really struggle to be consistent with this pair, (i.e. by ignoring fundamentals), due to the unique political nature of the United Kingdom. The recent drama surrounding Brexit has added another layer of uncertainty to this currency pair. With a smooth resolution not in the cards for the foreseeable future, it is clear the GBP/USD will be influenced by any developments and negotiations with the European Union.

The GBP/USD is the currency pair encompassing the United Kingdom’s currency, the British pound sterling (symbol £, code GBP), and the dollar of the United States of America (symbol $, code USD). The pair’s rate indicates how many US dollars are needed in order to purchase one British pound. For example, when the GBP/USD is trading at 1.5000, it means 1 pound is equivalent to 1.5 dollars. The GBP/USD is the fourth most traded currency pair on the forex exchange market, giving it ample liquidity and a low spread. Whilst the spreads of currency pairs vary from broker to broker, generally speaking, the GBP/USD often stays within the 1 pip to 3 pip spread range, making it a decent candidate for scalping. The GBP/USD pair, also informally known as “cable” (due to transatlantic cables being used to transmit its exchange rate via telegraph back in the 19th century) has a positive correlation with the EUR/USD, and a negative correlation with the USD/CHF. Trading the GBP/USDWhilst a lot of traders and even brokers will assert that the best time to trade the GBP/USD is during its most active hours during London and New York, doing so can be a double-edged sword due to the often-unpredictable nature of the pair. Its volatility also fluctuates often, and so what could be a profitable looking strategy one month, may not be so productive in later months. In addition, purely technical traders can really struggle to be consistent with this pair, (i.e. by ignoring fundamentals), due to the unique political nature of the United Kingdom. The recent drama surrounding Brexit has added another layer of uncertainty to this currency pair. With a smooth resolution not in the cards for the foreseeable future, it is clear the GBP/USD will be influenced by any developments and negotiations with the European Union.
Read this Term
moved below a swing area on the daily chart on Monday. That swing area came between 1.3133 and 1.31868. The selling continued on Tuesday to the lowest low since early November 2020 at 1.30808. However the price snapback higher yesterday, and retested the high of the swing area. Today that high was eclipsed, but only to 1.31938 – about seven pips above the upper extreme.

The inability to push higher turned buyers back to sellers and the price has since moved back down toward the lower extreme of the swing area near 1.3133. Get below that level and stay below would have traders targeting the low for the week at 1.30808 again and potentially other lower levels. It also would reestablish the upper end of the swing area as key resistance. Stay below is more bearish.

RELATED POSTS

EURGBP erases gains and returns to a familiar bias defining level

New highs for US stocks. The Nasdaq continues to lead

USDJPY has 3 key technical levels that have stalled the rally higher today

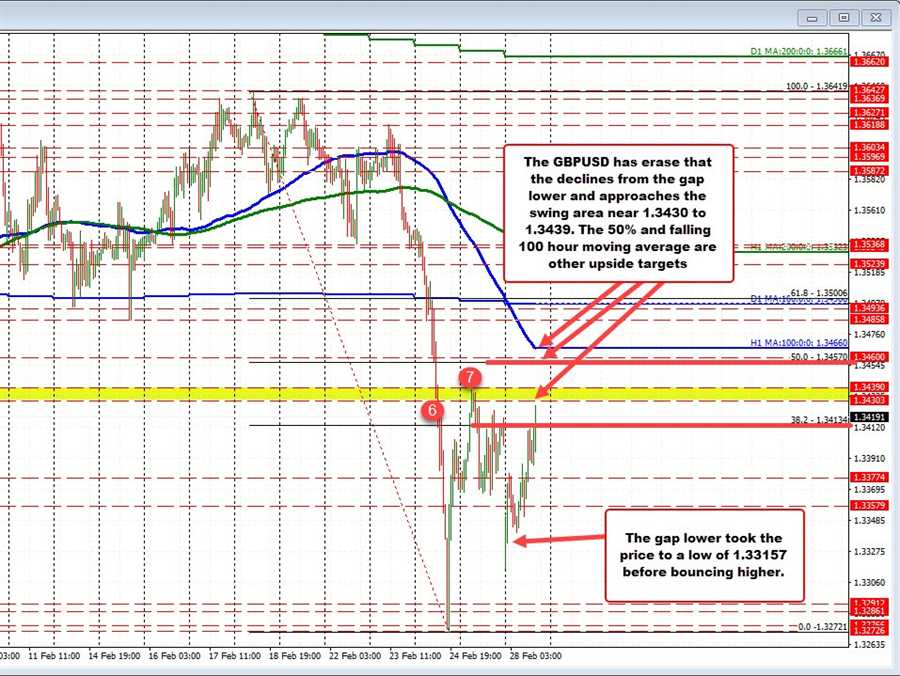
Drilling to the hourly chart below, the extensions above the 1.3186 level was short lived and without increased momentum. The most recent price decline has now taken the price to a new session low for the day. That move has seen the price also move back below its 100 hour moving average (blue line) at 1.3154.

Admittedly, the price has traded above and below that moving average for most of the day. Nevertheless the move lower and the fall below the 1.3133 lower extreme is more bearish. Traders in the short term can now use the 100 hour moving average as close resistance. Stay below is more bearish. Then look for the traders to make a run toward the 1.30808 low for the week.

GBPUSD

GBPUSD moves to a new session low
ADVERTISEMENT – CONTINUE READING BELOW

Source link

ShareTweetPin
A.R Chowdhury

A.R Chowdhury

Related Posts

EURGBP erases gains and returns to a familiar bias defining level
ANALYSIS

EURGBP erases gains and returns to a familiar bias defining level

August 14, 2022
New highs for US stocks. The Nasdaq continues to lead
ANALYSIS

New highs for US stocks. The Nasdaq continues to lead

August 14, 2022
USDJPY has 3 key technical levels that have stalled the rally higher today
ANALYSIS

USDJPY has 3 key technical levels that have stalled the rally higher today

August 14, 2022
WTI crude oil futures settle at $92.09
ANALYSIS

WTI crude oil futures settle at $92.09

August 14, 2022
Bitcoin technical analysis, bulls might be giving up soon
ANALYSIS

Bitcoin technical analysis, bulls might be giving up soon

August 14, 2022
The weekend forex technical report for the week of August 15, 2022
ANALYSIS

The weekend forex technical report for the week of August 15, 2022

August 14, 2022
Next Post
GBPUSD trades to new session lows and tests the lows for the week

GBPUSD trades to new session lows and tests the lows for the week

Major US indices open lower after the correction higher yesterday

Major US indices open lower after the correction higher yesterday

Leave a Reply Cancel reply

Your email address will not be published. Required fields are marked *

Recommended Stories

AUD/USD inches higher as buyers start to wrestle back some near-term control

May 7, 2020

USD extends lower with the USDCHF the biggest mover

August 14, 2021

Major US indices open lower

June 2, 2020

Popular Stories

  • The USD is the strongest and the NZD is the weakest as the NA session begins

    0 shares
    Share 0 Tweet 0
  • New highs for US stocks. The Nasdaq continues to lead

    0 shares
    Share 0 Tweet 0
  • EURGBP erases gains and returns to a familiar bias defining level

    0 shares
    Share 0 Tweet 0
  • What is forex and How does it work?

    0 shares
    Share 0 Tweet 0
  • What is CFD trading?

    0 shares
    Share 0 Tweet 0
Forex Review Online

© 2022 My Forex Review - Designed with Jnews Theme.

Navigate Site

  • Home
  • Crypto
  • Education
  • News

Follow Us

No Result
View All Result
  • Home
  • Crypto
  • Education
  • News

© 2022 My Forex Review - Designed with Jnews Theme.