Price of GBPUSD also falls below 50% midpoint of move up from the July 20 low
The GBPUSD cracked below its 200 day moving average at 1.3777. Also near that level is the 50% retracement of the move up from the July 20 low ( see hourly chart below). The breaking of those key levels has tilted the bias even more to the downside. That dual level is now intraday risk for sellers. Stay below is more bearish.
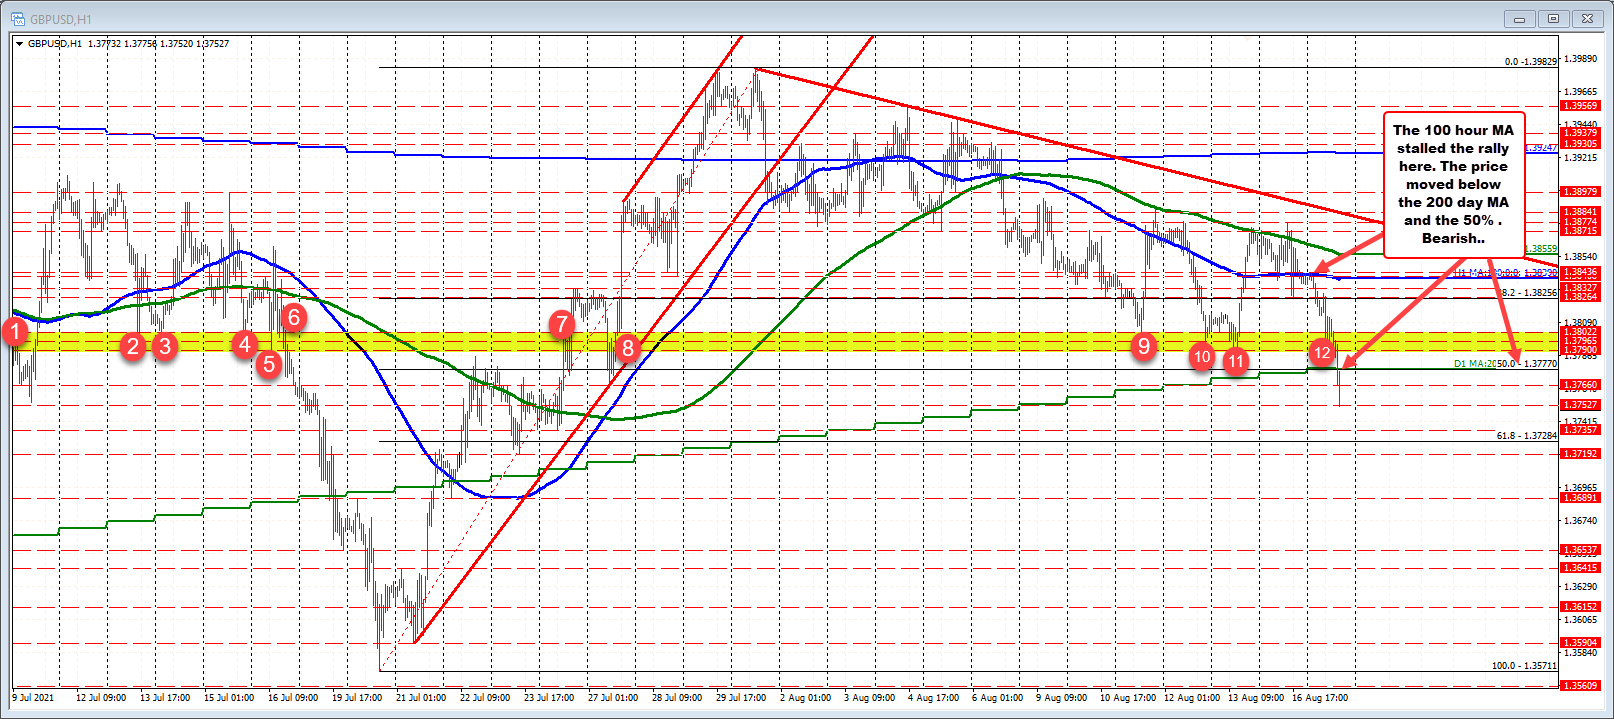
Looking at the chart, the day today started with the price near its 100 hour moving average at 1.3839 (see blue linei n the chart above). Sellers leaned against that moving average and started to push the price lower. A swing area between 1.3790 and 1.3802 was also broken and has helped lead to more downside momentum.
The 61.8% retracement of the move up from the July 20 low comes in at 1.3728. that retracement is book ended by swing lows from July 23 and July 26 at 1.3719 and 1.37357.


