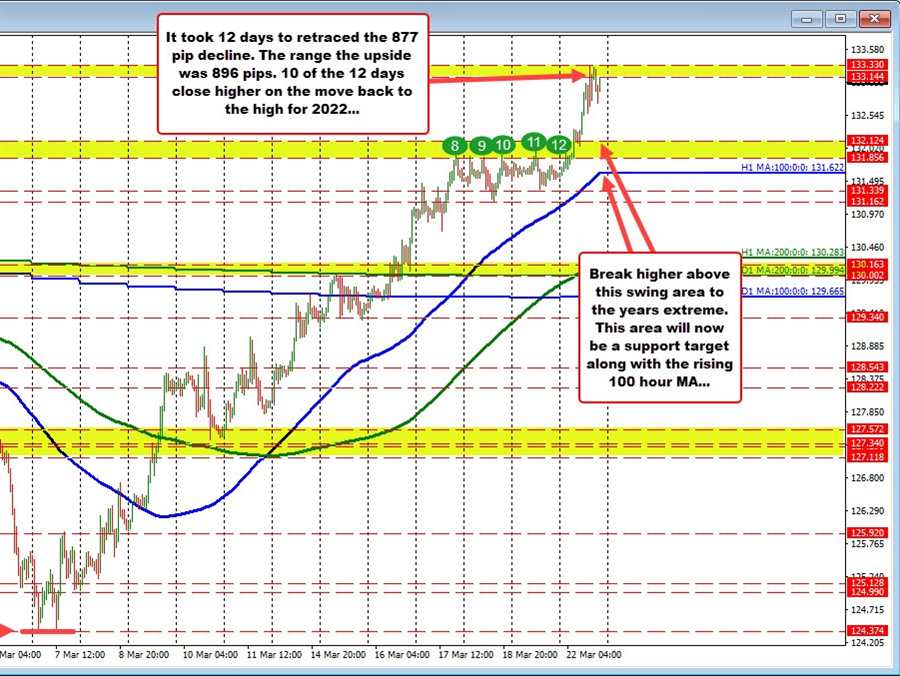
Forex Review Online
No Result
View All Result
  • Home
  • Crypto
  • Education
  • News
start trading today
  • Home
  • Crypto
  • Education
  • News
No Result
View All Result
Forex Review Online
No Result
View All Result
Home ANALYSIS

EURJPY completes the down and up lap

A.R Chowdhury by A.R Chowdhury
March 22, 2022
Reading Time: 4 mins read
0
EURJPY completes the down and up lap

EURJPY

EURJPY completes the down and up lap of near 900 pips

RELATED POSTS

EURGBP erases gains and returns to a familiar bias defining level

New highs for US stocks. The Nasdaq continues to lead

USDJPY has 3 key technical levels that have stalled the rally higher today

The  EURJPY 
EUR/JPY

The EUR/JPY is the currency pair encompassing the European Union’s single currency, the euro (symbol €, code EUR), and the Japanese yen of Japan (symbol ¥, code JPY).  The pair’s rate indicates how many Japanese yen are needed in order to purchase one euro. For example, when the EUR/JPY is trading at 125.00, it means 1 euro is equivalent to 125 Japanese yen. The euro (EUR) is the world’s second most traded currency, whilst the Japanese yen (JPY) is the world’s third most traded currency, resulting in an extremely liquid pair. Why the EUR/JPY Remains an Attractive Option for TradersWhilst the spreads of currency pairs vary from broker to broker, generally speaking the EUR/JPY often stays within the 1 pip to 3 pip spread range. The EUR/JPY is one of a select few pairs which have a low spread yet decent daily range.  Important news announcements for this pair include the Consumer Price Index (CPI) for the Eurozone. Releases such as these give an idea of changes in the price of goods and services, and the Jobless Rate for Japan, which measures the percentage of unemployed in the country.For example, if this figure comes out as a lower percentage, it indicates strength in the Japanese economy, thereby pushing the EUR/JPY lower. Out of all the JPY pairs, it is the EUR/JPY that is arguably the most attractive to the broad spectrum of traders, regardless of their method of trading. Its low spread plus high volatility makes it a great candidate for both short- and long-term trading. Compared to the USD/JPY, it has a higher spread but higher range, whereas compared to the GBP/JPY, it has a lower spread but also a lower range. In this sense the EUR/JPY combines the best of both worlds, which explains part of its appeal

The EUR/JPY is the currency pair encompassing the European Union’s single currency, the euro (symbol €, code EUR), and the Japanese yen of Japan (symbol ¥, code JPY).  The pair’s rate indicates how many Japanese yen are needed in order to purchase one euro. For example, when the EUR/JPY is trading at 125.00, it means 1 euro is equivalent to 125 Japanese yen. The euro (EUR) is the world’s second most traded currency, whilst the Japanese yen (JPY) is the world’s third most traded currency, resulting in an extremely liquid pair. Why the EUR/JPY Remains an Attractive Option for TradersWhilst the spreads of currency pairs vary from broker to broker, generally speaking the EUR/JPY often stays within the 1 pip to 3 pip spread range. The EUR/JPY is one of a select few pairs which have a low spread yet decent daily range.  Important news announcements for this pair include the Consumer Price Index (CPI) for the Eurozone. Releases such as these give an idea of changes in the price of goods and services, and the Jobless Rate for Japan, which measures the percentage of unemployed in the country.For example, if this figure comes out as a lower percentage, it indicates strength in the Japanese economy, thereby pushing the EUR/JPY lower. Out of all the JPY pairs, it is the EUR/JPY that is arguably the most attractive to the broad spectrum of traders, regardless of their method of trading. Its low spread plus high volatility makes it a great candidate for both short- and long-term trading. Compared to the USD/JPY, it has a higher spread but higher range, whereas compared to the GBP/JPY, it has a lower spread but also a lower range. In this sense the EUR/JPY combines the best of both worlds, which explains part of its appeal
Read this Term
reached a high on February 10th at 133.14, and bottomed at 124.37 on March 7.

Since then the last 12 trading days has seen a full retracement of the 877 pip decline with the price moving briefly above the February 10 high to a high of 133.33 (range of 896 pips from the low to the high).

It took 17 days to take the journey down, and 12 days to take the journey back up (10 of 12 days closed higher on the way up). Near the extreme the price move back above a lower swing area between 131.856 and 132.124. That area will be eyed along with the rising 100 hour MA at 131.65 as support. Stay above keeps the buyers in control firm control. Move below those levels and the trend move tranisitions into from strong like bull, to more mixed bias with sellers taking back some control. .

ADVERTISEMENT – CONTINUE READING BELOW

Source link

ShareTweetPin
A.R Chowdhury

A.R Chowdhury

Related Posts

EURGBP erases gains and returns to a familiar bias defining level
ANALYSIS

EURGBP erases gains and returns to a familiar bias defining level

August 14, 2022
New highs for US stocks. The Nasdaq continues to lead
ANALYSIS

New highs for US stocks. The Nasdaq continues to lead

August 14, 2022
USDJPY has 3 key technical levels that have stalled the rally higher today
ANALYSIS

USDJPY has 3 key technical levels that have stalled the rally higher today

August 14, 2022
WTI crude oil futures settle at $92.09
ANALYSIS

WTI crude oil futures settle at $92.09

August 14, 2022
Bitcoin technical analysis, bulls might be giving up soon
ANALYSIS

Bitcoin technical analysis, bulls might be giving up soon

August 14, 2022
The weekend forex technical report for the week of August 15, 2022
ANALYSIS

The weekend forex technical report for the week of August 15, 2022

August 14, 2022
Next Post
AUDUSD trades to new highs as risk-on sends the currency higher

AUDUSD trades to new highs as risk-on sends the currency higher

Major indices close with solid gains and near highs.

Major indices close with solid gains and near highs.

Leave a Reply Cancel reply

Your email address will not be published. Required fields are marked *

Recommended Stories

Major US stock indices open mixed

July 20, 2020

EURUSD moves back toward the 100 hour MA

July 7, 2020

EURJPY tests 100 and 200 hour moving average

May 5, 2020

Popular Stories

  • New highs for US stocks. The Nasdaq continues to lead

    New highs for US stocks. The Nasdaq continues to lead

    0 shares
    Share 0 Tweet 0
  • The USD is the strongest and the NZD is the weakest as the NA session begins

    0 shares
    Share 0 Tweet 0
  • EURGBP erases gains and returns to a familiar bias defining level

    0 shares
    Share 0 Tweet 0
  • What is forex and How does it work?

    0 shares
    Share 0 Tweet 0
  • Bitcoin technical analysis, bulls might be giving up soon

    0 shares
    Share 0 Tweet 0
Forex Review Online

© 2022 My Forex Review - Designed with Jnews Theme.

Navigate Site

  • Home
  • Crypto
  • Education
  • News

Follow Us

No Result
View All Result
  • Home
  • Crypto
  • Education
  • News

© 2022 My Forex Review - Designed with Jnews Theme.