Forex Review Online
No Result
View All Result
  • Home
  • Crypto
  • Education
  • News
start trading today
  • Home
  • Crypto
  • Education
  • News
No Result
View All Result
Forex Review Online
No Result
View All Result
Home ANALYSIS

USDJPY moves higher in early trading

A.R Chowdhury by A.R Chowdhury
March 21, 2022
Reading Time: 4 mins read
0
USDJPY moves higher in early trading

USDJPY

USDJPY on the hourly chart

Japan is on holiday in observance of vernal equinox day, but that is not stopping the  USDJPY 
USD/JPY

The USD/JPY is the currency pair encompassing the dollar of the United States of America (symbol $, code USD), and the Japanese yen of Japan (symbol ¥, code JPY). The pair’s rate indicates how many Japanese yen are needed in order to purchase one US dollar. For example, when the USD/JPY is trading at 100.00, it means 1 US dollar is equivalent to 100 Japanese yen.  The US dollar (USD) is the world’s most traded currency, whilst the Japanese yen is the world’s third most traded currency, resulting in an extremely liquid pair, and very tight spreads, often staying within the 0 pip to 2 pip spread range on most forex brokers. Although the range of the USD/JPY isn’t traditionally particularly high, the lack of large price action often associated with other JPY pairs does make it easier to trade.This is especially true for short-term traders, although without offering a great pip potential. Even though the USD/JPY is the world’s second most traded pair, it’s not as popular as one might think with regards to retail traders.The pair carries a reputation as “boring”, although this isn’t an entirely accurate reflection. Trading the USD/JPYThe JPY is highly regarded as a safe haven currency, with investors often increasing their exposure following periods of uncertainty or market-induced fallouts.As both the US and Japan are highly developed economies, there are several key factors affecting the value of either currencies. This includes a range of economic indicators such as gross domestic product (GDP) growth, inflation, interest rates and unemployment data. Monetary policy by the US Federal Reserve and Bank of Japan are also large determinants in the value of each currency.

The USD/JPY is the currency pair encompassing the dollar of the United States of America (symbol $, code USD), and the Japanese yen of Japan (symbol ¥, code JPY). The pair’s rate indicates how many Japanese yen are needed in order to purchase one US dollar. For example, when the USD/JPY is trading at 100.00, it means 1 US dollar is equivalent to 100 Japanese yen.  The US dollar (USD) is the world’s most traded currency, whilst the Japanese yen is the world’s third most traded currency, resulting in an extremely liquid pair, and very tight spreads, often staying within the 0 pip to 2 pip spread range on most forex brokers. Although the range of the USD/JPY isn’t traditionally particularly high, the lack of large price action often associated with other JPY pairs does make it easier to trade.This is especially true for short-term traders, although without offering a great pip potential. Even though the USD/JPY is the world’s second most traded pair, it’s not as popular as one might think with regards to retail traders.The pair carries a reputation as “boring”, although this isn’t an entirely accurate reflection. Trading the USD/JPYThe JPY is highly regarded as a safe haven currency, with investors often increasing their exposure following periods of uncertainty or market-induced fallouts.As both the US and Japan are highly developed economies, there are several key factors affecting the value of either currencies. This includes a range of economic indicators such as gross domestic product (GDP) growth, inflation, interest rates and unemployment data. Monetary policy by the US Federal Reserve and Bank of Japan are also large determinants in the value of each currency.
Read this Term
from moving higher in early trading.

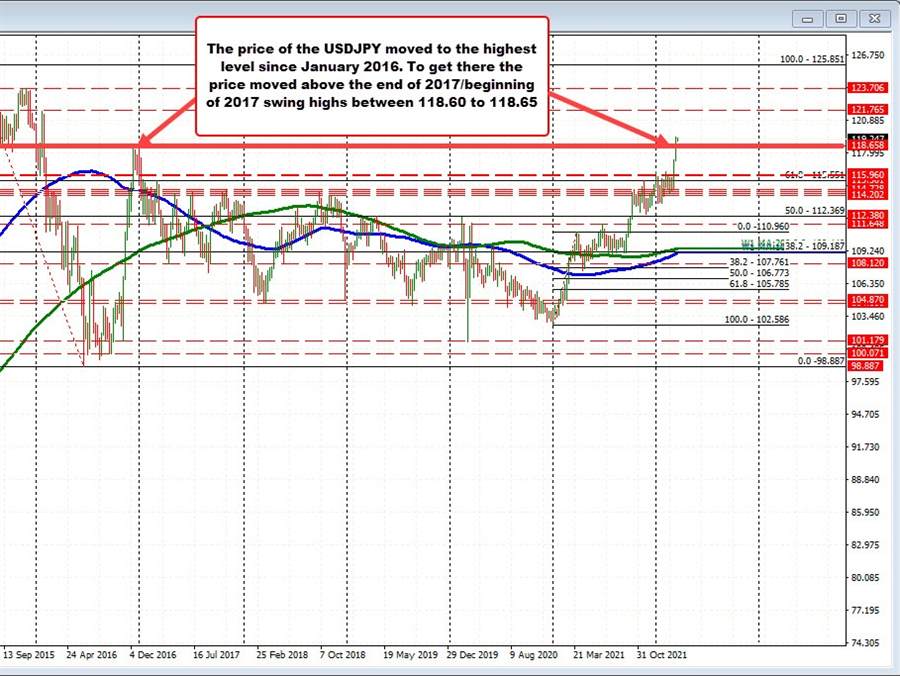
The pair did move back higher on Friday after Thursday’s modest dip broke a string of eight consecutive higher closes. The high price on Friday also saw the pair move to the highest level since the end of January 2016 to 119.392 (see daily chart below), before dipping modestly into the close (closed at 119.14).

RELATED POSTS

EURGBP erases gains and returns to a familiar bias defining level

New highs for US stocks. The Nasdaq continues to lead

USDJPY has 3 key technical levels that have stalled the rally higher today

Today the price is moving higher with the pair just reaching a intraday high of 119.30. The next key target remains the high from Friday at 119.392.

What would hurt the bullish bias on the hourly chart?

A trendline from March 10 connects recent lows from Thursday and Friday and cuts across at 118.908 currently (and moving higher – see red numbered circles on the hourly chart above).

A move below that level would have traders targeting the rising 100 hour moving average currently at 118.553. The price of the USDJPY has not traded below its 100 hour moving average since March 7 when the moving average was down at 115.29.

Below the 100 hour moving average and the 118.44 level would be another target to get to and through to increase the bearish bias

Taking a broader look at daily chart below, the price last week moved above the end of 2016/beginning of 2017 swing highs between 118.60 and 118.658. That area (just above the rising 100 hour MA) will also be a key support and bias defining level this week.

Move below that area (and the 100 hour MA) and there should be more selling momentum on the disappointment from the break higher.

USDJPY

USDJPY above resistance at 118.60-118.65
ADVERTISEMENT – CONTINUE READING BELOW

Source link

ShareTweetPin
A.R Chowdhury

A.R Chowdhury

Related Posts

EURGBP erases gains and returns to a familiar bias defining level
ANALYSIS

EURGBP erases gains and returns to a familiar bias defining level

August 14, 2022
New highs for US stocks. The Nasdaq continues to lead
ANALYSIS

New highs for US stocks. The Nasdaq continues to lead

August 14, 2022
USDJPY has 3 key technical levels that have stalled the rally higher today
ANALYSIS

USDJPY has 3 key technical levels that have stalled the rally higher today

August 14, 2022
WTI crude oil futures settle at $92.09
ANALYSIS

WTI crude oil futures settle at $92.09

August 14, 2022
Bitcoin technical analysis, bulls might be giving up soon
ANALYSIS

Bitcoin technical analysis, bulls might be giving up soon

August 14, 2022
The weekend forex technical report for the week of August 15, 2022
ANALYSIS

The weekend forex technical report for the week of August 15, 2022

August 14, 2022
Next Post
NZDUSD takes a peek above the 200 day MA. Can the price get to and through the MA level?

NZDUSD takes a peek above the 200 day MA. Can the price get to and through the MA level?

AUDUSD moves higher as commodities/yields rise

AUDUSD moves higher as commodities/yields rise

Leave a Reply Cancel reply

Your email address will not be published. Required fields are marked *

Recommended Stories

Oil falls back to unchanged on the day ahead of EIA inventory data

August 25, 2021

Stocks turn negative (again)

August 19, 2021

Saudi’s propose moving OPEC meeting to mid June

June 4, 2020

Popular Stories

  • New highs for US stocks. The Nasdaq continues to lead

    New highs for US stocks. The Nasdaq continues to lead

    0 shares
    Share 0 Tweet 0
  • The USD is the strongest and the NZD is the weakest as the NA session begins

    0 shares
    Share 0 Tweet 0
  • EURGBP erases gains and returns to a familiar bias defining level

    0 shares
    Share 0 Tweet 0
  • What is forex and How does it work?

    0 shares
    Share 0 Tweet 0
  • Bitcoin technical analysis, bulls might be giving up soon

    0 shares
    Share 0 Tweet 0
Forex Review Online

© 2022 My Forex Review - Designed with Jnews Theme.

Navigate Site

  • Home
  • Crypto
  • Education
  • News

Follow Us

No Result
View All Result
  • Home
  • Crypto
  • Education
  • News

© 2022 My Forex Review - Designed with Jnews Theme.