Forex Review Online
No Result
View All Result
  • Home
  • Crypto
  • Education
  • News
start trading today
  • Home
  • Crypto
  • Education
  • News
No Result
View All Result
Forex Review Online
No Result
View All Result
Home ANALYSIS

USDJPY continues the trend move to the upside. Here is why I know…..

A.R Chowdhury by A.R Chowdhury
March 14, 2022
Reading Time: 5 mins read
0
USDJPY continues the trend move to the upside. Here is why I know…..

USDJPY

USDJPY steps higher on the 5 minute chart

RELATED POSTS

EURGBP erases gains and returns to a familiar bias defining level

New highs for US stocks. The Nasdaq continues to lead

USDJPY has 3 key technical levels that have stalled the rally higher today

A trend move is most evident on the 5 minute chart (although it is obvious on other charts as well).

Often the look shows steps in the direction of the trend and modest corrections.

The steps – or legs – see the price start from a base, extend higher, correct toward the 38.2% -50% area, but stalls and restarts another leg in the direction of the trend.

Important is to measure the corrections of the individual legs (this is why I like to use the 5 minute chart). The 38.2 – 50% retracement area is of those individual legs and not the entire move.

The yellow areas in the chart above show the 38.2-50% of the trend legs. Note how corrections stall at or ahead of those area before moving higher.

So what are the reasons for this dynamic?

Trends are fast and directional. They also tend to go further than what traders expect. As a result the smart traders are aggressive on corrections. They buy early and against the 38.2-50% of the legs.

So when the trend started in the  USDJPY 
USD/JPY

The USD/JPY is the currency pair encompassing the dollar of the United States of America (symbol $, code USD), and the Japanese yen of Japan (symbol ¥, code JPY). The pair’s rate indicates how many Japanese yen are needed in order to purchase one US dollar. For example, when the USD/JPY is trading at 100.00, it means 1 US dollar is equivalent to 100 Japanese yen.  The US dollar (USD) is the world’s most traded currency, whilst the Japanese yen is the world’s third most traded currency, resulting in an extremely liquid pair, and very tight spreads, often staying within the 0 pip to 2 pip spread range on most forex brokers. Although the range of the USD/JPY isn’t traditionally particularly high, the lack of large price action often associated with other JPY pairs does make it easier to trade.This is especially true for short-term traders, although without offering a great pip potential. Even though the USD/JPY is the world’s second most traded pair, it’s not as popular as one might think with regards to retail traders.The pair carries a reputation as “boring”, although this isn’t an entirely accurate reflection. Trading the USD/JPYThe JPY is highly regarded as a safe haven currency, with investors often increasing their exposure following periods of uncertainty or market-induced fallouts.As both the US and Japan are highly developed economies, there are several key factors affecting the value of either currencies. This includes a range of economic indicators such as gross domestic product (GDP) growth, inflation, interest rates and unemployment data. Monetary policy by the US Federal Reserve and Bank of Japan are also large determinants in the value of each currency.

The USD/JPY is the currency pair encompassing the dollar of the United States of America (symbol $, code USD), and the Japanese yen of Japan (symbol ¥, code JPY). The pair’s rate indicates how many Japanese yen are needed in order to purchase one US dollar. For example, when the USD/JPY is trading at 100.00, it means 1 US dollar is equivalent to 100 Japanese yen.  The US dollar (USD) is the world’s most traded currency, whilst the Japanese yen is the world’s third most traded currency, resulting in an extremely liquid pair, and very tight spreads, often staying within the 0 pip to 2 pip spread range on most forex brokers. Although the range of the USD/JPY isn’t traditionally particularly high, the lack of large price action often associated with other JPY pairs does make it easier to trade.This is especially true for short-term traders, although without offering a great pip potential. Even though the USD/JPY is the world’s second most traded pair, it’s not as popular as one might think with regards to retail traders.The pair carries a reputation as “boring”, although this isn’t an entirely accurate reflection. Trading the USD/JPYThe JPY is highly regarded as a safe haven currency, with investors often increasing their exposure following periods of uncertainty or market-induced fallouts.As both the US and Japan are highly developed economies, there are several key factors affecting the value of either currencies. This includes a range of economic indicators such as gross domestic product (GDP) growth, inflation, interest rates and unemployment data. Monetary policy by the US Federal Reserve and Bank of Japan are also large determinants in the value of each currency.
Read this Term
after breaking above swing highs on March 10 and moving away from the 100/200 bar moving averages, on March 11, traders leaned against the 38.2% retracement of that move higher and restarted another trend move from 116.24 all the way up to 117.06. That next correction saw the price decline stall ahead of the 38.2% retracement 116.735 (the low was at 116.788). A new trend leg was started (and so on).

Traders who are on the trend, LOVE to see the 38.2-50% of the most recent trend leg hold support. That gives them clues that the trend is alive and well. There is nothing like confirmation that you are right.

The other side of the shallow corrections, is that the sellers in the USDJPY are losing, and the losses are accelerating without the ability to get out on a meaningful correction. So sellers in a trend lose money quickly. That dynamic helps to feed the trend.

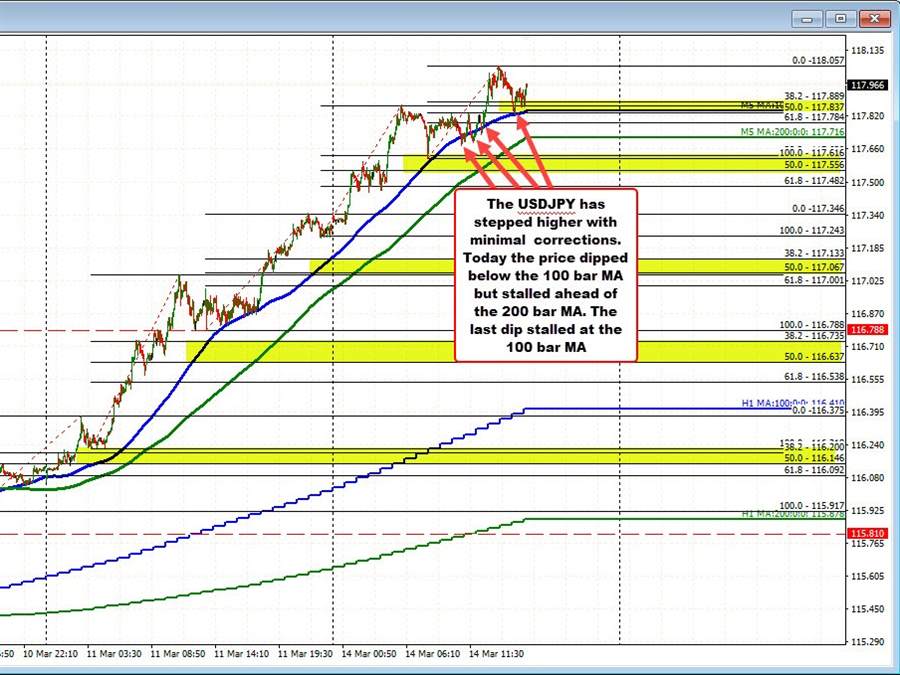
The other technical clue in a trend market off the five minute chart is that the 100/200 bar moving averages provide solid support.

In the chart above, during Friday’s trade, the price consolidated into the rising 100 bar moving average, found support buyers near that level and restarted the trend move to the upside.

Today, the price has dipped below the 100 bar moving average on three separate occasions, but could not extend through the 38.2 – 50% level nor reached the lower 200 bar moving average. In fact the price has not traded below the 200 bar moving average since March 10 when the trend move to the upside started.

If the sellers are to get some satisfaction, and the buyers are to lose control, getting below the 100 bar moving average and staying below, moving below the 200 bar moving average and moving below the 50% retracement of the last leg are the requirements. Absent that and the sellers are not winning. The buyers and the trend remain in tact.

Going forward it will take a move below the 100 bar MA and the 38.2-50% of the recent move higher. After that, a break of the 200 bar MA would be eyed. Absent those moves, the buyers still hold the sellers hostage. The trend is still in place.

Move below, and the waters get more muddy for the trend.

ADVERTISEMENT – CONTINUE READING BELOW

Source link

ShareTweetPin
A.R Chowdhury

A.R Chowdhury

Related Posts

EURGBP erases gains and returns to a familiar bias defining level
ANALYSIS

EURGBP erases gains and returns to a familiar bias defining level

August 14, 2022
New highs for US stocks. The Nasdaq continues to lead
ANALYSIS

New highs for US stocks. The Nasdaq continues to lead

August 14, 2022
USDJPY has 3 key technical levels that have stalled the rally higher today
ANALYSIS

USDJPY has 3 key technical levels that have stalled the rally higher today

August 14, 2022
WTI crude oil futures settle at $92.09
ANALYSIS

WTI crude oil futures settle at $92.09

August 14, 2022
Bitcoin technical analysis, bulls might be giving up soon
ANALYSIS

Bitcoin technical analysis, bulls might be giving up soon

August 14, 2022
The weekend forex technical report for the week of August 15, 2022
ANALYSIS

The weekend forex technical report for the week of August 15, 2022

August 14, 2022
Next Post
USDCAD trades above and below the 200 hour MA after run higher stalls within swing area

USDCAD trades above and below the 200 hour MA after run higher stalls within swing area

AUDUSD continues fall today but finds support near 100 day MA and bounces

AUDUSD continues fall today but finds support near 100 day MA and bounces

Leave a Reply Cancel reply

Your email address will not be published. Required fields are marked *

Recommended Stories

WTI July Crude oil futures settle at $31.65

May 18, 2020

Nasdaq index cracks 50 hour moving average and below the 11000 level

August 14, 2020
NASDAQ on track for is fourth straight day of gains

NASDAQ on track for is fourth straight day of gains

September 7, 2021

Popular Stories

  • The USD is the strongest and the NZD is the weakest as the NA session begins

    0 shares
    Share 0 Tweet 0
  • New highs for US stocks. The Nasdaq continues to lead

    0 shares
    Share 0 Tweet 0
  • EURGBP erases gains and returns to a familiar bias defining level

    0 shares
    Share 0 Tweet 0
  • What is forex and How does it work?

    0 shares
    Share 0 Tweet 0
  • What is CFD trading?

    0 shares
    Share 0 Tweet 0
Forex Review Online

© 2022 My Forex Review - Designed with Jnews Theme.

Navigate Site

  • Home
  • Crypto
  • Education
  • News

Follow Us

No Result
View All Result
  • Home
  • Crypto
  • Education
  • News

© 2022 My Forex Review - Designed with Jnews Theme.