Forex Review Online
No Result
View All Result
  • Home
  • Crypto
  • Education
  • News
start trading today
  • Home
  • Crypto
  • Education
  • News
No Result
View All Result
Forex Review Online
No Result
View All Result
Home ANALYSIS

USDJPY consolidates in narrow trading range near highest level since January 2017

A.R Chowdhury by A.R Chowdhury
March 16, 2022
Reading Time: 5 mins read
0
USDJPY consolidates in narrow trading range near highest level since January 2017

USDJPY

USDJPY moved up to test the end of 2016/early 2017 highs

As the news of a earthquake in Japan and subsequent tsunami warning reverberates through the news wires (7.3 is pretty significant – so far no nuclear reactor issues), the  USDJPY 
USD/JPY

The USD/JPY is the currency pair encompassing the dollar of the United States of America (symbol $, code USD), and the Japanese yen of Japan (symbol ¥, code JPY). The pair’s rate indicates how many Japanese yen are needed in order to purchase one US dollar. For example, when the USD/JPY is trading at 100.00, it means 1 US dollar is equivalent to 100 Japanese yen.  The US dollar (USD) is the world’s most traded currency, whilst the Japanese yen is the world’s third most traded currency, resulting in an extremely liquid pair, and very tight spreads, often staying within the 0 pip to 2 pip spread range on most forex brokers. Although the range of the USD/JPY isn’t traditionally particularly high, the lack of large price action often associated with other JPY pairs does make it easier to trade.This is especially true for short-term traders, although without offering a great pip potential. Even though the USD/JPY is the world’s second most traded pair, it’s not as popular as one might think with regards to retail traders.The pair carries a reputation as “boring”, although this isn’t an entirely accurate reflection. Trading the USD/JPYThe JPY is highly regarded as a safe haven currency, with investors often increasing their exposure following periods of uncertainty or market-induced fallouts.As both the US and Japan are highly developed economies, there are several key factors affecting the value of either currencies. This includes a range of economic indicators such as gross domestic product (GDP) growth, inflation, interest rates and unemployment data. Monetary policy by the US Federal Reserve and Bank of Japan are also large determinants in the value of each currency.

The USD/JPY is the currency pair encompassing the dollar of the United States of America (symbol $, code USD), and the Japanese yen of Japan (symbol ¥, code JPY). The pair’s rate indicates how many Japanese yen are needed in order to purchase one US dollar. For example, when the USD/JPY is trading at 100.00, it means 1 US dollar is equivalent to 100 Japanese yen.  The US dollar (USD) is the world’s most traded currency, whilst the Japanese yen is the world’s third most traded currency, resulting in an extremely liquid pair, and very tight spreads, often staying within the 0 pip to 2 pip spread range on most forex brokers. Although the range of the USD/JPY isn’t traditionally particularly high, the lack of large price action often associated with other JPY pairs does make it easier to trade.This is especially true for short-term traders, although without offering a great pip potential. Even though the USD/JPY is the world’s second most traded pair, it’s not as popular as one might think with regards to retail traders.The pair carries a reputation as “boring”, although this isn’t an entirely accurate reflection. Trading the USD/JPYThe JPY is highly regarded as a safe haven currency, with investors often increasing their exposure following periods of uncertainty or market-induced fallouts.As both the US and Japan are highly developed economies, there are several key factors affecting the value of either currencies. This includes a range of economic indicators such as gross domestic product (GDP) growth, inflation, interest rates and unemployment data. Monetary policy by the US Federal Reserve and Bank of Japan are also large determinants in the value of each currency.
Read this Term
remains within a narrow trading range near the highest level since January 2017. The high price today has reached 118.422. The high price yesterday reached 118.444.

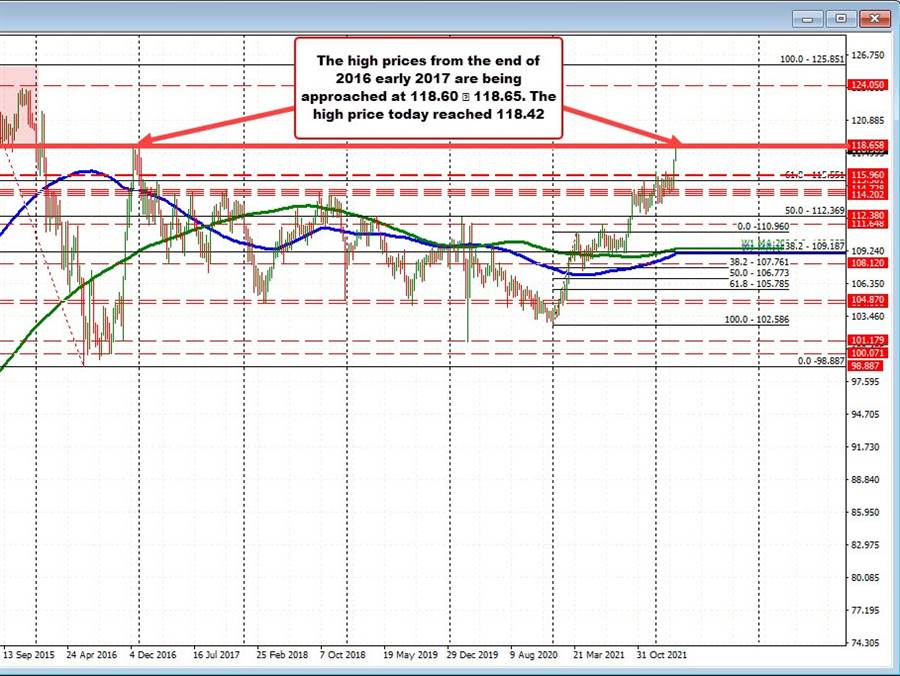
Going back to December and January 2016/17, the swing highs at that time reached 118.65 and 118.60 respectively (see weekly chart above). The price highs yesterday and today are approaching those levels. A break above would increase the bullish bias and send the price into the higher extreme area from late 2014, most of 2015 and into early 2016 that saw the price peak at 125.851 (see red shaded area in the chart above).

For today, the low to high trading range is confined to only 26 pips. The average over the last 22 trading days has been 66 pips (about a month of trading). There is room to roam and it seems the market is awaiting the next shove (from the FOMC decision?). However, the buyers are certainly remaining more in control given the narrow retracement.

Yesterday the trend move to the upside showed some cracks after breaking back below its 100 and 200 bar moving averages on the five minute chart (see blue and green lines in the chart below).

However, the price decline was modest (between the 38.2 – 50% of the move up from the last ledge near 116.788) did rebound into the close, and the price action today has seen a non-trending bias with the pair trading above and below its 100 and 200 bar moving averages.

USDJPY

USDJPY consolidates the recent gains

RELATED POSTS

EURGBP erases gains and returns to a familiar bias defining level

New highs for US stocks. The Nasdaq continues to lead

USDJPY has 3 key technical levels that have stalled the rally higher today

Also of note yesterday from a technical perspective is that the price decline stalled right near the underside of the broken trendline that occurred on Monday. The inability to move back below that trendline is another bullish signal that keeps the technical tilt to the upside (until broken). That trend line is at 117.78 today (and moving higher each day).

USDJPY

USDJPY stayed above the broken trendline

Summary: There are various clues from the 5-minute, daily and weekly charts today.

Clearly, the market is taking a breather ahead of the FOMC, but despite the correction yesterday, the buyers still hold more control (above the broken trend line on the daily chart at 117.78).

Having said that, getting above the high from yesterday and getting above the 118.60-118.65 area is still a key hurdle and would increase the bullish bias on a break – taking the pair into the high extreme for most of 2015. Moving below 117.78 (broken trend line) would start to weaken the technical view and should lead to more downside probing.

ADVERTISEMENT – CONTINUE READING BELOW

Source link

ShareTweetPin
A.R Chowdhury

A.R Chowdhury

Related Posts

EURGBP erases gains and returns to a familiar bias defining level
ANALYSIS

EURGBP erases gains and returns to a familiar bias defining level

August 14, 2022
New highs for US stocks. The Nasdaq continues to lead
ANALYSIS

New highs for US stocks. The Nasdaq continues to lead

August 14, 2022
USDJPY has 3 key technical levels that have stalled the rally higher today
ANALYSIS

USDJPY has 3 key technical levels that have stalled the rally higher today

August 14, 2022
WTI crude oil futures settle at $92.09
ANALYSIS

WTI crude oil futures settle at $92.09

August 14, 2022
Bitcoin technical analysis, bulls might be giving up soon
ANALYSIS

Bitcoin technical analysis, bulls might be giving up soon

August 14, 2022
The weekend forex technical report for the week of August 15, 2022
ANALYSIS

The weekend forex technical report for the week of August 15, 2022

August 14, 2022
Next Post
GBPJPY moves into a key upside swing area and backs off

GBPJPY moves into a key upside swing area and backs off

GBPUSD takes one technical step higher, but stalls ahead of the next step

GBPUSD takes one technical step higher, but stalls ahead of the next step

Leave a Reply Cancel reply

Your email address will not be published. Required fields are marked *

Recommended Stories

AUD/USD stays pressured after sellers defended the 100-day moving average

May 1, 2020

Microsoft 4Q 2020 earnings earnings to be released after the close

July 22, 2020
EURUSD trades down and up and back down. 100 hour MA stalls the rally

EURUSD trades down and up and back down. 100 hour MA stalls the rally

March 28, 2022

Popular Stories

  • New highs for US stocks. The Nasdaq continues to lead

    New highs for US stocks. The Nasdaq continues to lead

    0 shares
    Share 0 Tweet 0
  • The USD is the strongest and the NZD is the weakest as the NA session begins

    0 shares
    Share 0 Tweet 0
  • EURGBP erases gains and returns to a familiar bias defining level

    0 shares
    Share 0 Tweet 0
  • What is forex and How does it work?

    0 shares
    Share 0 Tweet 0
  • Bitcoin technical analysis, bulls might be giving up soon

    0 shares
    Share 0 Tweet 0
Forex Review Online

© 2022 My Forex Review - Designed with Jnews Theme.

Navigate Site

  • Home
  • Crypto
  • Education
  • News

Follow Us

No Result
View All Result
  • Home
  • Crypto
  • Education
  • News

© 2022 My Forex Review - Designed with Jnews Theme.