Forex Review Online
No Result
View All Result
  • Home
  • Crypto
  • Education
  • News
start trading today
  • Home
  • Crypto
  • Education
  • News
No Result
View All Result
Forex Review Online
No Result
View All Result
Home ANALYSIS

USDCAD runs above 100 hour MA as oil takes a tumble

A.R Chowdhury by A.R Chowdhury
March 28, 2022
Reading Time: 2 mins read
0
USDCAD runs above 100 hour MA as oil takes a tumble

USDCAD

USDCAD runs higher

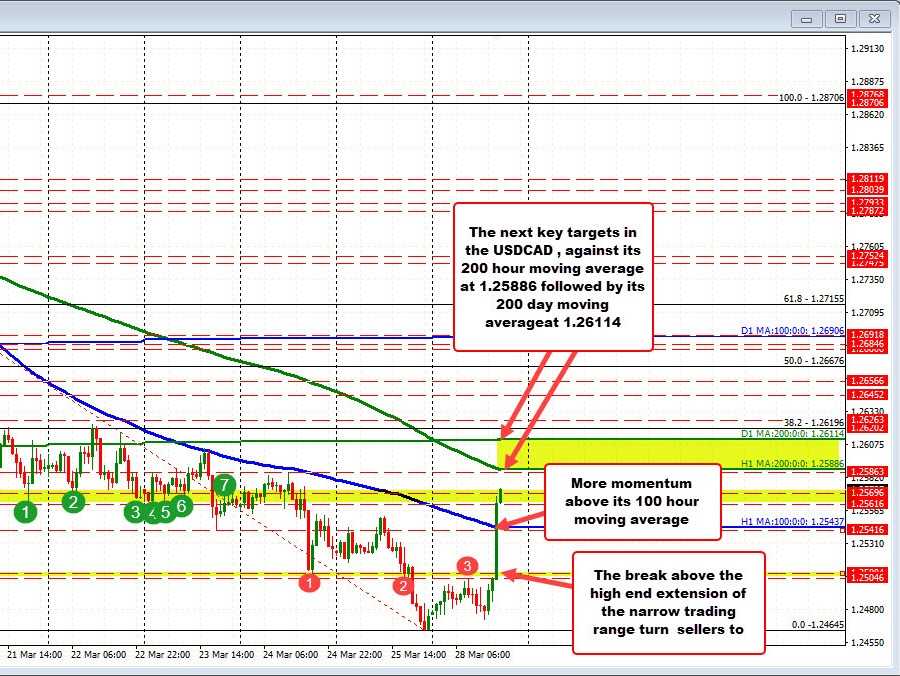
The USDCA has pushed above its 100 hour MA and looks to close above that MA for the first time since March 15th when the MA was at 1.2787. The current MA is at 1.25433.

The pair to the upside has been helped by tumbling oil prices. The price of crude oil is trading at $105.39. That’s down about $8.45 on the day.

The run to the upside comes after the pair has fallen for 9 consecutive days. That run has taken the price from a high of 1.28706 to the low reached on Friday at 1.24645 (406 pips in 9 days). The low took the price to the lowest level since January 20, but fell short of the low for the year at 1.24476, that was reached on January 19.

The North American session started with the pair stuck in a 31 pip trading range (very low range).

Looking at the hourly chart today, the price tried to initially move above the Thursday low at 1.2508. Recall that on Friday, the price traded above and below that level for a couple hours before breaking below, and increasing the momentum to the downside on its way to the session low at 1.24645 (lowest level since January 20).

However, in the last hour, the price was finally able to move above that old low, and saw buyers turn to sellers, extending the trading range from its low levels in the process (the average trading range over the last 22 days has been 97 pips. So there was room to roam).

The momentum higher continued up and has now moved to – and through – the 100 hour moving average 1.25437. The current price is now cracking above a swing area between 1.25616 and 1.25696. The next key target comes in against the falling 200 hour moving average 1.25886 (green line in the chart above).

There should be sellers on the first test of the 200 hour moving average) is also near the swing high from Thursday’s trade. Over a move above would have traders targeting its 200 day moving average 1.26114. The price traded above and below that 200 day moving average from March 18 through March 22, before choosing to continue the downside path.

Close risk for shorts now comes in at 1.2561 followed by the 100 hour moving average 1.25437. A move below the 100 hour moving average would certainly ruin the buyers day, and would swing the bias back to the downside.

ADVERTISEMENT – CONTINUE READING BELOW

Source link

RELATED POSTS

EURGBP erases gains and returns to a familiar bias defining level

New highs for US stocks. The Nasdaq continues to lead

USDJPY has 3 key technical levels that have stalled the rally higher today

ShareTweetPin
A.R Chowdhury

A.R Chowdhury

Related Posts

EURGBP erases gains and returns to a familiar bias defining level
ANALYSIS

EURGBP erases gains and returns to a familiar bias defining level

August 14, 2022
New highs for US stocks. The Nasdaq continues to lead
ANALYSIS

New highs for US stocks. The Nasdaq continues to lead

August 14, 2022
USDJPY has 3 key technical levels that have stalled the rally higher today
ANALYSIS

USDJPY has 3 key technical levels that have stalled the rally higher today

August 14, 2022
WTI crude oil futures settle at $92.09
ANALYSIS

WTI crude oil futures settle at $92.09

August 14, 2022
Bitcoin technical analysis, bulls might be giving up soon
ANALYSIS

Bitcoin technical analysis, bulls might be giving up soon

August 14, 2022
The weekend forex technical report for the week of August 15, 2022
ANALYSIS

The weekend forex technical report for the week of August 15, 2022

August 14, 2022
Next Post
NZDUSD corrects 38.2% of the move higher. Finds buyers on the first test.

NZDUSD corrects 38.2% of the move higher. Finds buyers on the first test.

S&P moved above the 100 day MA today but backed off. Is it signaling a top?

S&P moved above the 100 day MA today but backed off. Is it signaling a top?

Leave a Reply Cancel reply

Your email address will not be published. Required fields are marked *

Recommended Stories

USDRUB moves to a new high and gets closer to week highs

USDRUB moves to a new high and gets closer to week highs

March 4, 2022

EURUSD tests 100 day MA and backs off on the first test

May 19, 2020
AUDUSD is the strongest of the majors and trades to a new session high

AUDUSD is the strongest of the majors and trades to a new session high

March 17, 2022

Popular Stories

  • The USD is the strongest and the NZD is the weakest as the NA session begins

    0 shares
    Share 0 Tweet 0
  • EURGBP erases gains and returns to a familiar bias defining level

    0 shares
    Share 0 Tweet 0
  • New highs for US stocks. The Nasdaq continues to lead

    0 shares
    Share 0 Tweet 0
  • What is forex and How does it work?

    0 shares
    Share 0 Tweet 0
  • What is CFD trading?

    0 shares
    Share 0 Tweet 0
Forex Review Online

© 2022 My Forex Review - Designed with Jnews Theme.

Navigate Site

  • Home
  • Crypto
  • Education
  • News

Follow Us

No Result
View All Result
  • Home
  • Crypto
  • Education
  • News

© 2022 My Forex Review - Designed with Jnews Theme.