Forex Review Online
No Result
View All Result
  • Home
  • Crypto
  • Education
  • News
start trading today
  • Home
  • Crypto
  • Education
  • News
No Result
View All Result
Forex Review Online
No Result
View All Result
Home ANALYSIS

USDCAD moves toward topside swing area

A.R Chowdhury by A.R Chowdhury
March 7, 2022
Reading Time: 4 mins read
0
USDCAD moves toward topside swing area

USDCAD

The  USDCAD 
USD/CAD

The USD/CAD is the currency pair encompassing the dollar of the United States of America (symbol $, code USD), and the Canadian dollar of Canada (symbol $ code CAD). The pair’s exchange rate indicates how many Canadian dollars are needed in order to purchase one US dollar. For example, when the USD/CAD is trading at 1.3500, it means 1 US dollar is equivalent to 1.35 Canadian dollars. The US dollar (USD) is the world’s most traded currency, whilst the Canadian dollar (CAD) is the world’s seventh most traded currency. The United States and Canada are geographical neighbors, and as a result there is a lot of trade between the two countries. Thus, there is often decent volatility and low spreads for the USD/CAD, typically between 1 and 3 pips on most foreign exchange brokers. Factors Influencing the USD/CADThere are a number of important economic or news releases that can affect the USD/CAD. This includes among others, Non-Farm Payroll data for the US that are released on the first Friday of each month. Such metrics tell us whether employment is rising or falling, while the Gross Domestic Product (GDP) for Canada or the US, measure the total value of all goods and services produced by the country. In addition, the USD/CAD is known as a “Commodity Pair”, as Canada possesses large amounts of natural resources, specifically oil, which is its most traded commodity. As a result, it’s important for long term speculators of USD/CAD to keep a close eye on crude oil developments due to the strong negative correlation.

The USD/CAD is the currency pair encompassing the dollar of the United States of America (symbol $, code USD), and the Canadian dollar of Canada (symbol $ code CAD). The pair’s exchange rate indicates how many Canadian dollars are needed in order to purchase one US dollar. For example, when the USD/CAD is trading at 1.3500, it means 1 US dollar is equivalent to 1.35 Canadian dollars. The US dollar (USD) is the world’s most traded currency, whilst the Canadian dollar (CAD) is the world’s seventh most traded currency. The United States and Canada are geographical neighbors, and as a result there is a lot of trade between the two countries. Thus, there is often decent volatility and low spreads for the USD/CAD, typically between 1 and 3 pips on most foreign exchange brokers. Factors Influencing the USD/CADThere are a number of important economic or news releases that can affect the USD/CAD. This includes among others, Non-Farm Payroll data for the US that are released on the first Friday of each month. Such metrics tell us whether employment is rising or falling, while the Gross Domestic Product (GDP) for Canada or the US, measure the total value of all goods and services produced by the country. In addition, the USD/CAD is known as a “Commodity Pair”, as Canada possesses large amounts of natural resources, specifically oil, which is its most traded commodity. As a result, it’s important for long term speculators of USD/CAD to keep a close eye on crude oil developments due to the strong negative correlation.
Read this Term
has seen increased buying in the North American session today. Helping the move has been a move above and away from the 200 hour MA at 1.2727. Earlier the low for the day stalled near the rising 100 hour MA (blue line) currently at 1.26962. The buyers leaning near that level and pushing higher led to a more bullish bias.

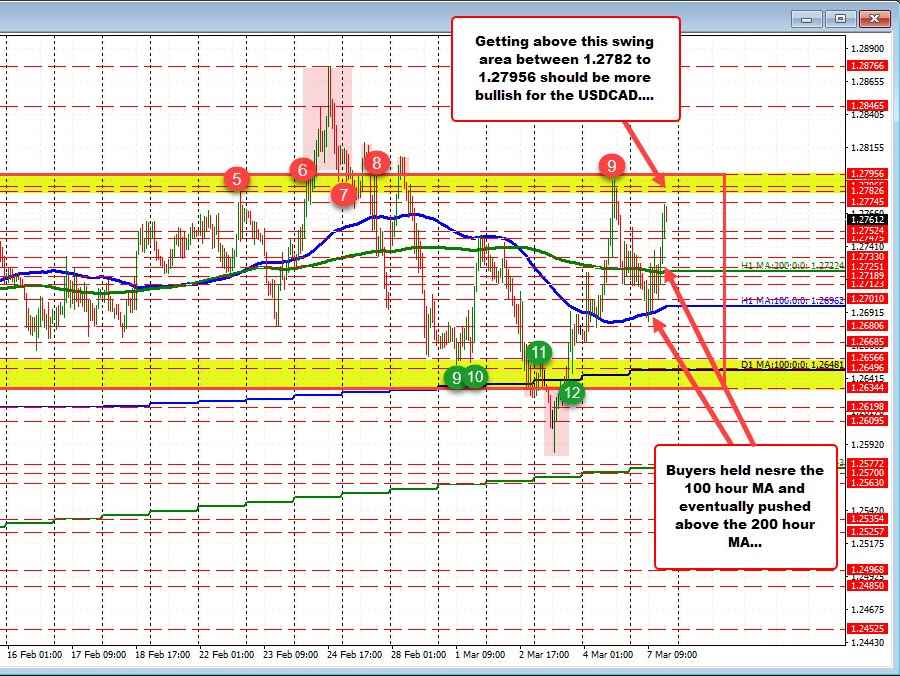
The move higher has taken the price to 1.2774. Above that level, sits a swing area between 1.2782 and 1.27956 (see red numbered circles). Back on February 24, February 25 and February 28, the price did extend above that area, taking the pair outside of what had been an up and down trading range. However, momentum could not be sustained on each of the breaks, and the price ultimately pushed to the downside.

Last week, the price rotated back below its 100 and 200 hour moving averages, and sellers had their opportunity to extend outside of the lower end of the up and down trading range. However like the buyers, their efforts failed and helped to lead to the run back to the upside on Thursday and Friday.

Overall, the bias today is more bullish, but with the ups and downs seen since January 26, along with the failed breaks (both higher and lower) more recently, traders may look to sell against resistance with stops on a break above.

Watch the 1.27956 as a resistance ceiling with stops on a break above.

On the downside it will now take a move back below the 200 hour moving average followed by the 100 hour moving average to get sellers more excited and at the potential for another test of the lower swing area (green numbered circles)

ADVERTISEMENT – CONTINUE READING BELOW

RELATED POSTS

EURGBP erases gains and returns to a familiar bias defining level

New highs for US stocks. The Nasdaq continues to lead

USDJPY has 3 key technical levels that have stalled the rally higher today

Source link

ShareTweetPin
A.R Chowdhury

A.R Chowdhury

Related Posts

EURGBP erases gains and returns to a familiar bias defining level
ANALYSIS

EURGBP erases gains and returns to a familiar bias defining level

August 14, 2022
New highs for US stocks. The Nasdaq continues to lead
ANALYSIS

New highs for US stocks. The Nasdaq continues to lead

August 14, 2022
USDJPY has 3 key technical levels that have stalled the rally higher today
ANALYSIS

USDJPY has 3 key technical levels that have stalled the rally higher today

August 14, 2022
WTI crude oil futures settle at $92.09
ANALYSIS

WTI crude oil futures settle at $92.09

August 14, 2022
Bitcoin technical analysis, bulls might be giving up soon
ANALYSIS

Bitcoin technical analysis, bulls might be giving up soon

August 14, 2022
The weekend forex technical report for the week of August 15, 2022
ANALYSIS

The weekend forex technical report for the week of August 15, 2022

August 14, 2022
Next Post
Wheat futures are up limit for the 6th day in a row

Wheat futures are up limit for the 6th day in a row

USDJPY hangs above 100/200 hour MAs

USDJPY hangs above 100/200 hour MAs

Leave a Reply Cancel reply

Your email address will not be published. Required fields are marked *

Recommended Stories

US stocks open higher. S&P and Dow looking to break its four day lose streak

US stocks open higher. S&P and Dow looking to break its four day lose streak

September 10, 2021

GBPUSD bounced back up to retest the 200 day MA

June 12, 2020

NASDAQ rises over 200 points

July 7, 2020

Popular Stories

  • New highs for US stocks. The Nasdaq continues to lead

    New highs for US stocks. The Nasdaq continues to lead

    0 shares
    Share 0 Tweet 0
  • The USD is the strongest and the NZD is the weakest as the NA session begins

    0 shares
    Share 0 Tweet 0
  • EURGBP erases gains and returns to a familiar bias defining level

    0 shares
    Share 0 Tweet 0
  • What is forex and How does it work?

    0 shares
    Share 0 Tweet 0
  • Bitcoin technical analysis, bulls might be giving up soon

    0 shares
    Share 0 Tweet 0
Forex Review Online

© 2022 My Forex Review - Designed with Jnews Theme.

Navigate Site

  • Home
  • Crypto
  • Education
  • News

Follow Us

No Result
View All Result
  • Home
  • Crypto
  • Education
  • News

© 2022 My Forex Review - Designed with Jnews Theme.