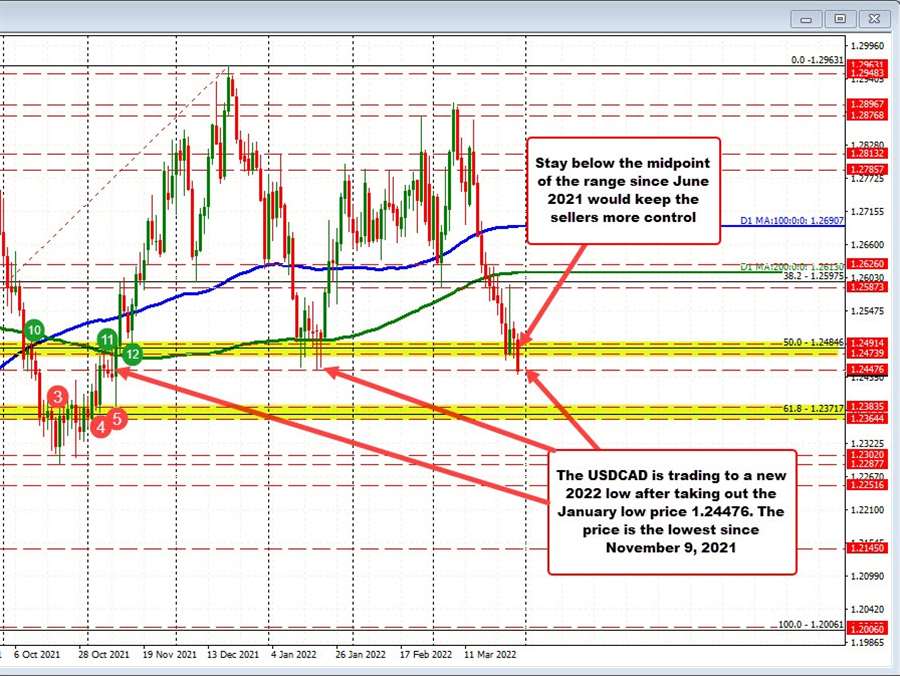
Forex Review Online
No Result
View All Result
  • Home
  • Crypto
  • Education
  • News
start trading today
  • Home
  • Crypto
  • Education
  • News
No Result
View All Result
Forex Review Online
No Result
View All Result
Home ANALYSIS

USDCAD moves to lowest level since November 10

A.R Chowdhury by A.R Chowdhury
March 30, 2022
Reading Time: 4 mins read
0
USDCAD moves to lowest level since November 10

USDCAD

USDCAD trades to a new 2022 low

The  USDCAD 
USD/CAD

The USD/CAD is the currency pair encompassing the dollar of the United States of America (symbol $, code USD), and the Canadian dollar of Canada (symbol $ code CAD). The pair’s exchange rate indicates how many Canadian dollars are needed in order to purchase one US dollar. For example, when the USD/CAD is trading at 1.3500, it means 1 US dollar is equivalent to 1.35 Canadian dollars. The US dollar (USD) is the world’s most traded currency, whilst the Canadian dollar (CAD) is the world’s seventh most traded currency. The United States and Canada are geographical neighbors, and as a result there is a lot of trade between the two countries. Thus, there is often decent volatility and low spreads for the USD/CAD, typically between 1 and 3 pips on most foreign exchange brokers. Factors Influencing the USD/CADThere are a number of important economic or news releases that can affect the USD/CAD. This includes among others, Non-Farm Payroll data for the US that are released on the first Friday of each month. Such metrics tell us whether employment is rising or falling, while the Gross Domestic Product (GDP) for Canada or the US, measure the total value of all goods and services produced by the country. In addition, the USD/CAD is known as a “Commodity Pair”, as Canada possesses large amounts of natural resources, specifically oil, which is its most traded commodity. As a result, it’s important for long term speculators of USD/CAD to keep a close eye on crude oil developments due to the strong negative correlation.

The USD/CAD is the currency pair encompassing the dollar of the United States of America (symbol $, code USD), and the Canadian dollar of Canada (symbol $ code CAD). The pair’s exchange rate indicates how many Canadian dollars are needed in order to purchase one US dollar. For example, when the USD/CAD is trading at 1.3500, it means 1 US dollar is equivalent to 1.35 Canadian dollars. The US dollar (USD) is the world’s most traded currency, whilst the Canadian dollar (CAD) is the world’s seventh most traded currency. The United States and Canada are geographical neighbors, and as a result there is a lot of trade between the two countries. Thus, there is often decent volatility and low spreads for the USD/CAD, typically between 1 and 3 pips on most foreign exchange brokers. Factors Influencing the USD/CADThere are a number of important economic or news releases that can affect the USD/CAD. This includes among others, Non-Farm Payroll data for the US that are released on the first Friday of each month. Such metrics tell us whether employment is rising or falling, while the Gross Domestic Product (GDP) for Canada or the US, measure the total value of all goods and services produced by the country. In addition, the USD/CAD is known as a “Commodity Pair”, as Canada possesses large amounts of natural resources, specifically oil, which is its most traded commodity. As a result, it’s important for long term speculators of USD/CAD to keep a close eye on crude oil developments due to the strong negative correlation.
Read this Term
has moved to a new session low in the process took out the January 19, 2022 low for the year at 1.24476. The low price just reached 1.24407. The price has not traded this low since November 10, 2021.

Looking at the daily chart, the price is been trading above and below its 50% midpoint of the range since the June 2021 low. That midpoint comes in at 1.24846. On the daily chart of the price can stay below that level, the sellers would be more control. On the downside off the daily chart, the next target area comes between 1.2364 and 1.2383. That area brackets the 61.8% retracement at 1.23717.

RELATED POSTS

EURGBP erases gains and returns to a familiar bias defining level

New highs for US stocks. The Nasdaq continues to lead

USDJPY has 3 key technical levels that have stalled the rally higher today

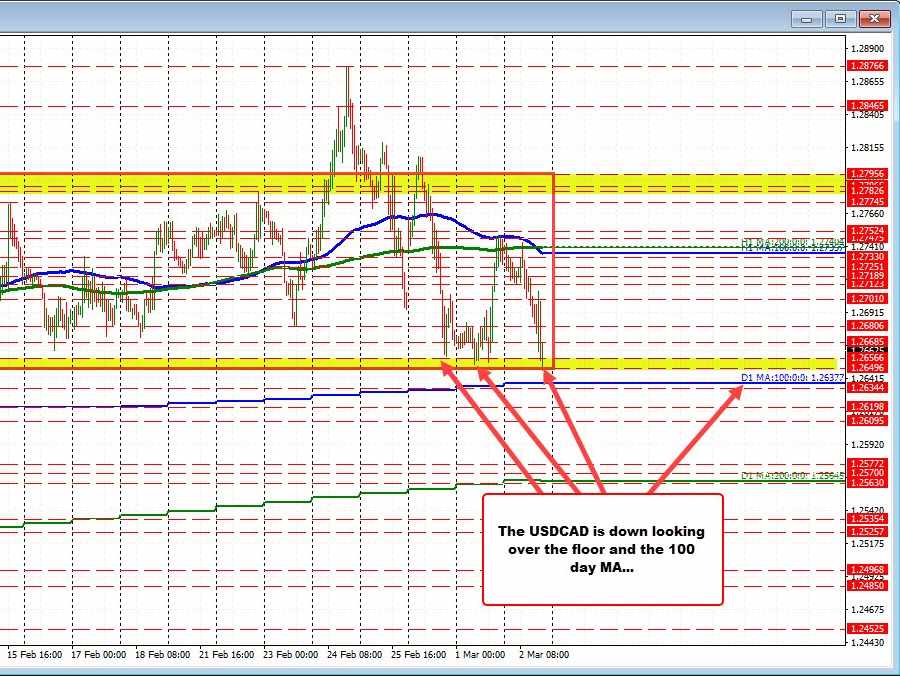
Drilling to the hourly chart below, the Monday high stalled near its 200 hour moving average (green line), and yesterday, the price high stalled against its 100 hour moving average.

The inability to move above those moving average levels give the sellers the go-ahead to move to the downside. The pair in the last hourly bar broke below the swing lows from last Friday and yesterday near the 1.2465 level.

Close resistance would now be that area near 1.2465. Stay below keeps the sellers in firm control on the break.

More conservative resistance would come against the falling 100 hour moving average 1.2509 currently. Move above that level would give buyers some added comfort, and give sellers additional cause for pause after the break lower failure.

For now, the sellers are in control below 1.24645.

USDCAD

USDCAD falls below the swing lows from Friday and yesterday
ADVERTISEMENT – CONTINUE READING BELOW

Source link

ShareTweetPin
A.R Chowdhury

A.R Chowdhury

Related Posts

EURGBP erases gains and returns to a familiar bias defining level
ANALYSIS

EURGBP erases gains and returns to a familiar bias defining level

August 14, 2022
New highs for US stocks. The Nasdaq continues to lead
ANALYSIS

New highs for US stocks. The Nasdaq continues to lead

August 14, 2022
USDJPY has 3 key technical levels that have stalled the rally higher today
ANALYSIS

USDJPY has 3 key technical levels that have stalled the rally higher today

August 14, 2022
WTI crude oil futures settle at $92.09
ANALYSIS

WTI crude oil futures settle at $92.09

August 14, 2022
Bitcoin technical analysis, bulls might be giving up soon
ANALYSIS

Bitcoin technical analysis, bulls might be giving up soon

August 14, 2022
The weekend forex technical report for the week of August 15, 2022
ANALYSIS

The weekend forex technical report for the week of August 15, 2022

August 14, 2022
Next Post
EURUSD trades to the highest level since March 1

EURUSD trades to the highest level since March 1

The AUDUSD buyers and sellers are battling it out near 2022 highs

The AUDUSD buyers and sellers are battling it out near 2022 highs

Leave a Reply Cancel reply

Your email address will not be published. Required fields are marked *

Recommended Stories

The euro is off and running. Levels to watch

July 27, 2020
European shares end the day with solid gains

European shares end the day with solid gains

September 7, 2020
Delta variant limiting production output

Delta variant limiting production output

August 20, 2021

Popular Stories

  • The USD is the strongest and the NZD is the weakest as the NA session begins

    0 shares
    Share 0 Tweet 0
  • New highs for US stocks. The Nasdaq continues to lead

    0 shares
    Share 0 Tweet 0
  • EURGBP erases gains and returns to a familiar bias defining level

    0 shares
    Share 0 Tweet 0
  • What is forex and How does it work?

    0 shares
    Share 0 Tweet 0
  • What is CFD trading?

    0 shares
    Share 0 Tweet 0
Forex Review Online

© 2022 My Forex Review - Designed with Jnews Theme.

Navigate Site

  • Home
  • Crypto
  • Education
  • News

Follow Us

No Result
View All Result
  • Home
  • Crypto
  • Education
  • News

© 2022 My Forex Review - Designed with Jnews Theme.