Forex Review Online
No Result
View All Result
  • Home
  • Crypto
  • Education
  • News
start trading today
  • Home
  • Crypto
  • Education
  • News
No Result
View All Result
Forex Review Online
No Result
View All Result
Home ANALYSIS

USDCAD back below the 100 hour MA and back into old swing area

A.R Chowdhury by A.R Chowdhury
March 10, 2022
Reading Time: 6 mins read
0
USDCAD back below the 100 hour MA and back into old swing area

USDCAD

USDCAD falls back below its 100 hour moving average

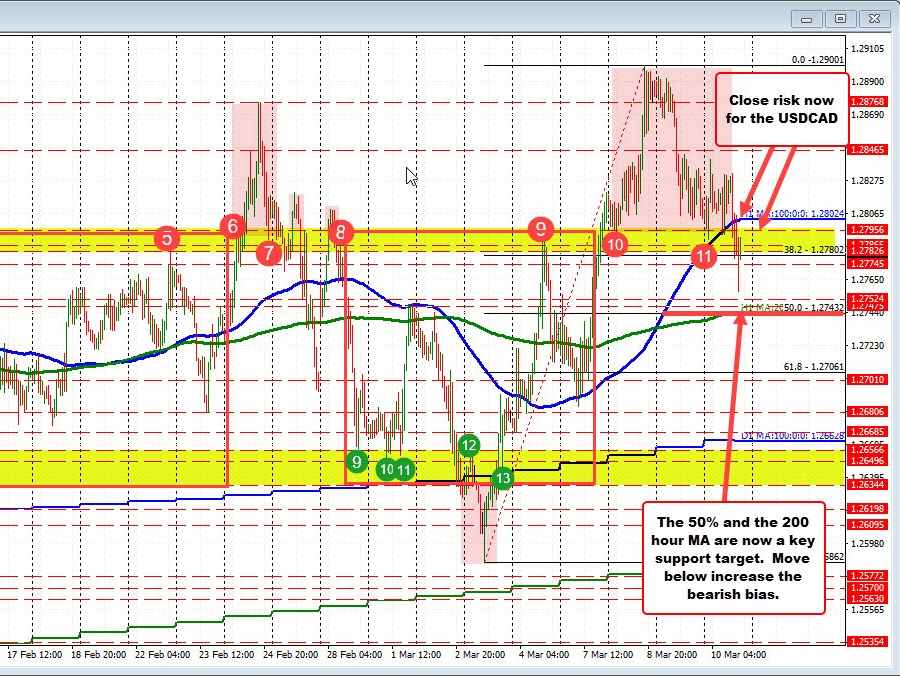
Recall back in January /February, the price of the  USDCAD 
USD/CAD

The USD/CAD is the currency pair encompassing the dollar of the United States of America (symbol $, code USD), and the Canadian dollar of Canada (symbol $ code CAD). The pair’s exchange rate indicates how many Canadian dollars are needed in order to purchase one US dollar. For example, when the USD/CAD is trading at 1.3500, it means 1 US dollar is equivalent to 1.35 Canadian dollars. The US dollar (USD) is the world’s most traded currency, whilst the Canadian dollar (CAD) is the world’s seventh most traded currency. The United States and Canada are geographical neighbors, and as a result there is a lot of trade between the two countries. Thus, there is often decent volatility and low spreads for the USD/CAD, typically between 1 and 3 pips on most foreign exchange brokers. Factors Influencing the USD/CADThere are a number of important economic or news releases that can affect the USD/CAD. This includes among others, Non-Farm Payroll data for the US that are released on the first Friday of each month. Such metrics tell us whether employment is rising or falling, while the Gross Domestic Product (GDP) for Canada or the US, measure the total value of all goods and services produced by the country. In addition, the USD/CAD is known as a “Commodity Pair”, as Canada possesses large amounts of natural resources, specifically oil, which is its most traded commodity. As a result, it’s important for long term speculators of USD/CAD to keep a close eye on crude oil developments due to the strong negative correlation.

The USD/CAD is the currency pair encompassing the dollar of the United States of America (symbol $, code USD), and the Canadian dollar of Canada (symbol $ code CAD). The pair’s exchange rate indicates how many Canadian dollars are needed in order to purchase one US dollar. For example, when the USD/CAD is trading at 1.3500, it means 1 US dollar is equivalent to 1.35 Canadian dollars. The US dollar (USD) is the world’s most traded currency, whilst the Canadian dollar (CAD) is the world’s seventh most traded currency. The United States and Canada are geographical neighbors, and as a result there is a lot of trade between the two countries. Thus, there is often decent volatility and low spreads for the USD/CAD, typically between 1 and 3 pips on most foreign exchange brokers. Factors Influencing the USD/CADThere are a number of important economic or news releases that can affect the USD/CAD. This includes among others, Non-Farm Payroll data for the US that are released on the first Friday of each month. Such metrics tell us whether employment is rising or falling, while the Gross Domestic Product (GDP) for Canada or the US, measure the total value of all goods and services produced by the country. In addition, the USD/CAD is known as a “Commodity Pair”, as Canada possesses large amounts of natural resources, specifically oil, which is its most traded commodity. As a result, it’s important for long term speculators of USD/CAD to keep a close eye on crude oil developments due to the strong negative correlation.
Read this Term
was stuck in a range from 1.26344 to 1.27956 (see red box)

On February 24, 25 and 28, the price tried to extend higher with some success, but also failed to keep the break above in play.

RELATED POSTS

EURGBP erases gains and returns to a familiar bias defining level

New highs for US stocks. The Nasdaq continues to lead

USDJPY has 3 key technical levels that have stalled the rally higher today

Buyers turned sellers, and the pair fell sharply. Ultimately, the price fell below the lower extreme of the red box on March 3rd. Like the breaks higher outside the top extreme, the break lower also failed(see red shaded area on the downside). That started the process back to the upside.

This week, the price moved back above the higher extreme at 1.27956 late on Monday, and ran to a new cycle high at 1.2900. That natural  resistance level 
Resistance Level

A trading resistance or resistance level reflects a given price that acts as a temporary ceiling for an asset. In its most basic form, this level pressures an asset’s price from rising above it, either acting as an outright barrier or exerting pressure in doing so.This pressure is due to a growing number of sellers who wish to sell at the particular price at a defined resistance level. Resistance levels can either be temporary constructs, longer-lasting ones, or purely psychological. As a result, several factors can control resistance levels or cause these to change over time. In terms of technical analysis, a simple resistance level can be calculated by drawing a line along the highest highs for the time period being considered. Resistance differs notably from support levels, which operate inversely. Understanding the Basics of Resistance LevelsResistance levels do not have to only be flat lines, but can also represent slanted pricing levels relative to trend lines. There are both simplistic and advanced ways to calculate resistance levels and doing so forms the foundation of technical analysis. Any asset trader can map out their strategies or place stop-loss orders in line with resistance levels. A resistance level equates to the price at which enough traders intend to sell the particular asset, thereby outnumbering the buyers in terms of volume.As soon as price reaches this potential resistance, the number of sellers increase, preventing price from increasing further. Resistance presents itself across all timeframes, generally speaking, the higher the timeframe, the stronger these levels manage to hold.

A trading resistance or resistance level reflects a given price that acts as a temporary ceiling for an asset. In its most basic form, this level pressures an asset’s price from rising above it, either acting as an outright barrier or exerting pressure in doing so.This pressure is due to a growing number of sellers who wish to sell at the particular price at a defined resistance level. Resistance levels can either be temporary constructs, longer-lasting ones, or purely psychological. As a result, several factors can control resistance levels or cause these to change over time. In terms of technical analysis, a simple resistance level can be calculated by drawing a line along the highest highs for the time period being considered. Resistance differs notably from support levels, which operate inversely. Understanding the Basics of Resistance LevelsResistance levels do not have to only be flat lines, but can also represent slanted pricing levels relative to trend lines. There are both simplistic and advanced ways to calculate resistance levels and doing so forms the foundation of technical analysis. Any asset trader can map out their strategies or place stop-loss orders in line with resistance levels. A resistance level equates to the price at which enough traders intend to sell the particular asset, thereby outnumbering the buyers in terms of volume.As soon as price reaches this potential resistance, the number of sellers increase, preventing price from increasing further. Resistance presents itself across all timeframes, generally speaking, the higher the timeframe, the stronger these levels manage to hold.
Read this Term
found sellers and the last two days has seen a rotation back to the downside.

Today, the price in the North American session has moved back below both the 100 hour MA (at 1.28024) and the high of the old “red box” at 1.27956 once again. Another failure. Another red shade area.

What now?

The move to the downside today below the 100 hour MA at 1.28024 and into the red box, now reestablishes those levels as resistance. I would expect sellers between 1.27956 and 1.28024.

Stay below and the bears are full in control. Move above and all bets for further downside are off.

On the downside, the 200 hour MA and the 50% midpoint of the move up from the March 3 low come in at 1.27432. That level is the next major target on the downside for the pair.

Move below it and it will open the door for further selling with 1.2706 (61.8%) and the 100 day MA at 1.26628 as the next major targets. The lower swing area between 1.26344 to 1.26586 would also be in play (again) on more momentum.

ADVERTISEMENT – CONTINUE READING BELOW

Source link

ShareTweetPin
A.R Chowdhury

A.R Chowdhury

Related Posts

EURGBP erases gains and returns to a familiar bias defining level
ANALYSIS

EURGBP erases gains and returns to a familiar bias defining level

August 14, 2022
New highs for US stocks. The Nasdaq continues to lead
ANALYSIS

New highs for US stocks. The Nasdaq continues to lead

August 14, 2022
USDJPY has 3 key technical levels that have stalled the rally higher today
ANALYSIS

USDJPY has 3 key technical levels that have stalled the rally higher today

August 14, 2022
WTI crude oil futures settle at $92.09
ANALYSIS

WTI crude oil futures settle at $92.09

August 14, 2022
Bitcoin technical analysis, bulls might be giving up soon
ANALYSIS

Bitcoin technical analysis, bulls might be giving up soon

August 14, 2022
The weekend forex technical report for the week of August 15, 2022
ANALYSIS

The weekend forex technical report for the week of August 15, 2022

August 14, 2022
Next Post
GBPUSD fails on move above high of swing area

GBPUSD fails on move above high of swing area

GBPUSD trades to new session lows and tests the lows for the week

GBPUSD trades to new session lows and tests the lows for the week

Leave a Reply Cancel reply

Your email address will not be published. Required fields are marked *

Recommended Stories

NASDAQ index was back above the 10,000 level

June 30, 2020

Euro Stoxx index falls for the first time in 11 trading sessions

August 17, 2021
The AUDUSD is lower for the 2nd consecutive day and back between 100/200D MAs

The AUDUSD is lower for the 2nd consecutive day and back between 100/200D MAs

March 8, 2022

Popular Stories

  • The USD is the strongest and the NZD is the weakest as the NA session begins

    0 shares
    Share 0 Tweet 0
  • New highs for US stocks. The Nasdaq continues to lead

    0 shares
    Share 0 Tweet 0
  • EURGBP erases gains and returns to a familiar bias defining level

    0 shares
    Share 0 Tweet 0
  • What is forex and How does it work?

    0 shares
    Share 0 Tweet 0
  • What is CFD trading?

    0 shares
    Share 0 Tweet 0
Forex Review Online

© 2022 My Forex Review - Designed with Jnews Theme.

Navigate Site

  • Home
  • Crypto
  • Education
  • News

Follow Us

No Result
View All Result
  • Home
  • Crypto
  • Education
  • News

© 2022 My Forex Review - Designed with Jnews Theme.