Forex Review Online
No Result
View All Result
  • Home
  • Crypto
  • Education
  • News
start trading today
  • Home
  • Crypto
  • Education
  • News
No Result
View All Result
Forex Review Online
No Result
View All Result
Home ANALYSIS

Ups and downs continue in the EURUSD. Back down and below the 200 hour MA again

A.R Chowdhury by A.R Chowdhury
March 24, 2022
Reading Time: 4 mins read
0
Ups and downs continue in the EURUSD. Back down and below the 200 hour MA again

EURUSD

EURUSD back below the 200 hour MA

RELATED POSTS

EURGBP erases gains and returns to a familiar bias defining level

New highs for US stocks. The Nasdaq continues to lead

USDJPY has 3 key technical levels that have stalled the rally higher today

The  EURUSD 
EUR/USD

The EUR/USD is the currency pair encompassing the European Union’s single currency, the euro (symbol €, code EUR), and the dollar of the United States (symbol $, code USD). The pair’s rate indicates how many euros are needed in order to purchase one dollar. For example, when the EUR/USD is trading at 1.2, it means 1 euro is equivalent to 1.2 dollars.  Why the EUR/USD is the Most Popular Trading PairCompared to all tradable currencies, the euro (EUR) is the world’s second most traded currency, behind only the US dollar. This currency pair is the most traded and liquid currency pair on the market.As the most popular trading pair, the EUR/USD is a staple of every brokerage offering and often has some of the lowest spreads relative to other pairs. Ultimately, the currency follows the two most economic blocs in the world and sees the most volume for this reason.The EUR/USD has a wide range of factors that influence its rates. From the EUR side, economic data in the Eurozone as well as internal factors in the bloc can easily impact rates. Even small member states can effectively weigh on the EUR, as seen in Greece during bailout talks in the 2010s. Alternatively, developments in the United States and the Federal Reserve commonly affect the EUR/USD. Many examples include the bailouts during the Financial crisis, tax cuts during the Trump Administration, and Covid-19 relief measures, among others.

The EUR/USD is the currency pair encompassing the European Union’s single currency, the euro (symbol €, code EUR), and the dollar of the United States (symbol $, code USD). The pair’s rate indicates how many euros are needed in order to purchase one dollar. For example, when the EUR/USD is trading at 1.2, it means 1 euro is equivalent to 1.2 dollars.  Why the EUR/USD is the Most Popular Trading PairCompared to all tradable currencies, the euro (EUR) is the world’s second most traded currency, behind only the US dollar. This currency pair is the most traded and liquid currency pair on the market.As the most popular trading pair, the EUR/USD is a staple of every brokerage offering and often has some of the lowest spreads relative to other pairs. Ultimately, the currency follows the two most economic blocs in the world and sees the most volume for this reason.The EUR/USD has a wide range of factors that influence its rates. From the EUR side, economic data in the Eurozone as well as internal factors in the bloc can easily impact rates. Even small member states can effectively weigh on the EUR, as seen in Greece during bailout talks in the 2010s. Alternatively, developments in the United States and the Federal Reserve commonly affect the EUR/USD. Many examples include the bailouts during the Financial crisis, tax cuts during the Trump Administration, and Covid-19 relief measures, among others.
Read this Term
moved higher yesterday, after first breaking below the 200 hour MA in the Asian session after testing the MA and holding support against it last week.

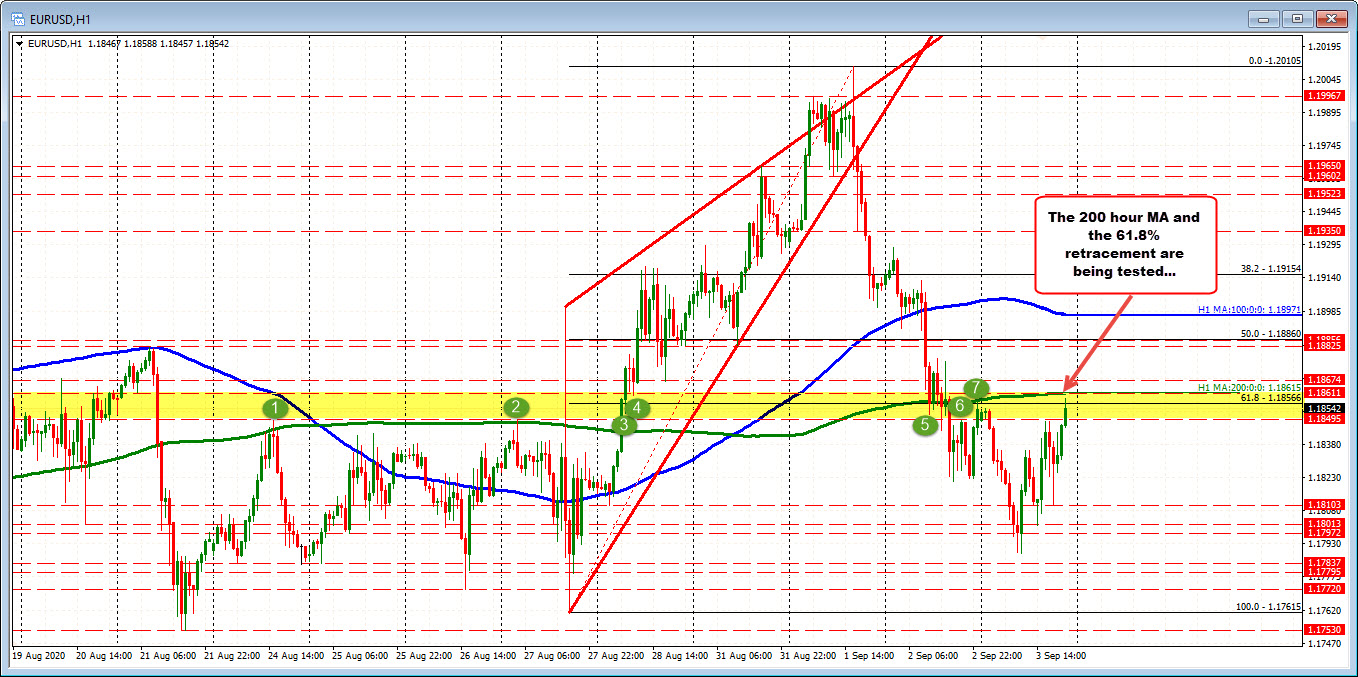
The move lower in the Asian session could not be sustained however. and the price rotated back higher (and above the 200 hour MA level) in the early North American session. That move higher ended up near the 100 hour moving average (blue line).

That moving average was broken by a few pips but could not sustain momentum and the price settled the day “between the goal posts” defined by the 100 hour moving average above (blue line near 1.1039) and the 200 hour moving average below (green line near 1.10059).

Today, in the European session, the price has moved back below the 200 hour moving average at 1.10059 (green line in the chart above), and has been able to hold resistance against that level a couple hourly bars. Keeping below the 200 hour moving average keeps the sellers more control.

The price is currently trading around 1.0985 after reaching a low of 1.0974. That low was just above the 50% midpoint target of the move up from the March 7 low (that midpoint comes in at 1.0971).

Get below the 50% retracement and traders will start to next target the recent swing lows including:

  • Yesterday’s low at 1.0960.
  • 1.09487 from March 16,
  • 1.09242 from March 15 and
  • 1.0899 from March 11 and March 14.

I hate to say it as it is repetitive of late, but a move back above the 200 hour moving average at 1.1093 would tilt the bias back more toward the buy side (close risk for sellers now), with the 100 hour moving average at 1.10393 as the next upside target. A move above the 100 hour moving average would open the door for further upside momentum.

For now however, the sellers are leaning against the 200 hour moving average and that puts them (i.e. the sellers) more in the driver’s seat for today.

ADVERTISEMENT – CONTINUE READING BELOW

Source link

ShareTweetPin
A.R Chowdhury

A.R Chowdhury

Related Posts

EURGBP erases gains and returns to a familiar bias defining level
ANALYSIS

EURGBP erases gains and returns to a familiar bias defining level

August 14, 2022
New highs for US stocks. The Nasdaq continues to lead
ANALYSIS

New highs for US stocks. The Nasdaq continues to lead

August 14, 2022
USDJPY has 3 key technical levels that have stalled the rally higher today
ANALYSIS

USDJPY has 3 key technical levels that have stalled the rally higher today

August 14, 2022
WTI crude oil futures settle at $92.09
ANALYSIS

WTI crude oil futures settle at $92.09

August 14, 2022
Bitcoin technical analysis, bulls might be giving up soon
ANALYSIS

Bitcoin technical analysis, bulls might be giving up soon

August 14, 2022
The weekend forex technical report for the week of August 15, 2022
ANALYSIS

The weekend forex technical report for the week of August 15, 2022

August 14, 2022
Next Post
The CAD is the strongest and the JPY is the weakest as NA traders enter for the day

The CAD is the strongest and the JPY is the weakest as NA traders enter for the day

EURUSD falls away from 200 hour MA (again). Holding midpoint of move up from March 7

EURUSD falls away from 200 hour MA (again). Holding midpoint of move up from March 7

Leave a Reply Cancel reply

Your email address will not be published. Required fields are marked *

Recommended Stories

The USDJPY tested the 200 bar MA on the 4-hour and backed off.

June 11, 2020
USDJPY bottoms near bottoms

USDJPY bottoms near bottoms

September 14, 2021
USD/JPY eases to fresh three-week lows but price action still largely contained

USD/JPY eases to fresh three-week lows but price action still largely contained

September 15, 2021

Popular Stories

  • The USD is the strongest and the NZD is the weakest as the NA session begins

    0 shares
    Share 0 Tweet 0
  • New highs for US stocks. The Nasdaq continues to lead

    0 shares
    Share 0 Tweet 0
  • EURGBP erases gains and returns to a familiar bias defining level

    0 shares
    Share 0 Tweet 0
  • What is forex and How does it work?

    0 shares
    Share 0 Tweet 0
  • What is CFD trading?

    0 shares
    Share 0 Tweet 0
Forex Review Online

© 2022 My Forex Review - Designed with Jnews Theme.

Navigate Site

  • Home
  • Crypto
  • Education
  • News

Follow Us

No Result
View All Result
  • Home
  • Crypto
  • Education
  • News

© 2022 My Forex Review - Designed with Jnews Theme.