


In the dynamic world of forex trading, understanding chart patterns is crucial for making informed decisions. Forex candlestick patterns are one of the most popular tools used by traders to predict market movements and assess potential trading opportunities. This article delves into the intricacies of forex candlestick patterns, providing you with expert insights and practical tips to enhance your trading strategy.
Introduction to Forex Candlestick Patterns

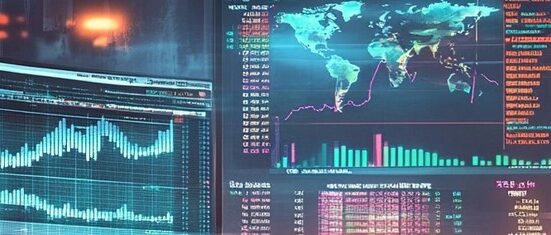
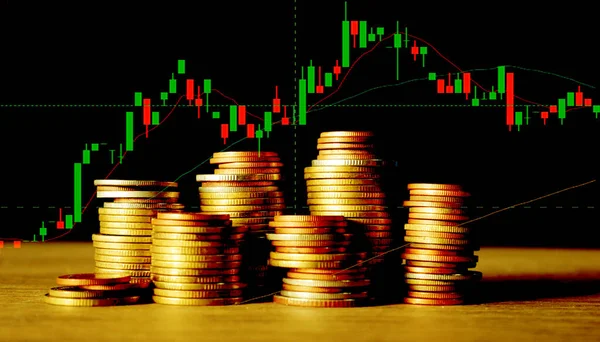
Forex candlestick patterns are graphical representations of price movements in the forex market, displayed on candlestick charts. Each candlestick provides a visual depiction of price action within a specific time frame, capturing key information about the market’s open, high, low, and close prices. Originating from Japanese rice trading in the 18th century, these patterns have become essential tools for traders worldwide.
Candlestick patterns are effective because they offer a clear visual interpretation of market dynamics and trader sentiment. By understanding and interpreting these patterns, traders can gauge potential price movements and make informed trading decisions.
Key Components of a Candlestick Chart

To fully grasp forex candlestick patterns, it is important to understand the components of a candlestick chart:
- Body: The body of a candlestick represents the range between the opening and closing prices. If the closing price is higher than the opening price, the candlestick is bullish (often colored green or white). Conversely, if the closing price is lower than the opening price, the candlestick is bearish (typically colored red or black).
- Wicks (Shadows): The wicks, or shadows, are the lines extending from the top and bottom of the body. The upper wick indicates the highest price reached during the time frame, while the lower wick signifies the lowest price.
- Open/Close: These are the prices at which the market opened and closed for the specific time period of the candlestick.
Understanding these components is the first step toward analyzing candlestick patterns effectively.
Analyzing Bullish Candlestick Patterns
Bullish candlestick patterns suggest that the market is poised to rise. Here are some common bullish patterns:
- Hammer: This pattern features a small body with a long lower wick. It indicates that although there was selling pressure, the buyers drove the price back up, signifying potential bullish reversal.
- Morning Star: A three-candle pattern that starts with a long bearish candle, followed by a smaller candle, and ends with a bullish candle. It suggests a reversal from bearish to bullish sentiment.
- Bullish Engulfing: Occurs when a small bearish candle is followed by a larger bullish candle that completely engulfs the previous candle’s body. This pattern indicates strong buying interest.
Understanding Bearish Candlestick Signals
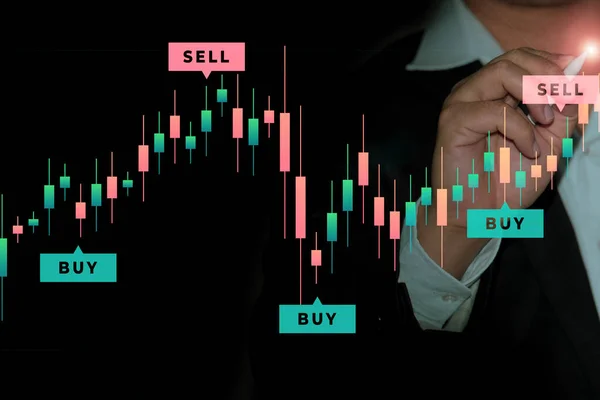
Bearish candlestick patterns indicate potential market downturns. Key patterns include:
- Shooting Star: Characterized by a small body with a long upper wick, this pattern suggests that the buyers attempted to push the price higher but were overpowered by sellers.
- Evening Star: The inverse of the Morning Star, this three-candle pattern starts with a bullish candle, followed by a small-bodied candle, and concludes with a bearish candle, pointing to a potential downtrend.
- Bearish Engulfing: Similar to its bullish counterpart, this pattern involves a small bullish candle followed by a larger bearish candle, signaling strong selling pressure.
Recognizing Reversal Candlestick Patterns

Reversal patterns signal potential changes in market direction:
- Doji: A Doji occurs when the opening and closing prices are nearly identical, forming a cross-like shape. It represents indecision in the market and can signal a potential reversal when occurring at market tops or bottoms.
- Harami: This two-candle pattern consists of a large candlestick followed by a smaller candlestick contained within the previous one’s body. In a downtrend, a bullish Harami can indicate a reversal, and in an uptrend, a bearish Harami can suggest a downturn.
Strategies for Trading with Candlestick Analysis

Trading with candlestick analysis involves combining these patterns with other technical indicators to increase the probability of successful trades. Here are some tips:
- Confirm with Indicators: Use indicators like moving averages and RSI to confirm candlestick patterns and enhance their reliability.
- Consider Multiple Time Frames: Analyzing patterns on different time frames can provide a broader perspective on market trends.
- Manage Risk: Always use stop-loss orders to protect against unforeseen market movements, regardless of how reliable a pattern appears.
Comparative Table of Common Candlestick Patterns
| Pattern | Description | Bullish/Bearish | Typical Scenario |
|---|---|---|---|
| Hammer | Small body, long lower wick | Bullish | Indicates reversal in a downtrend |
| Shooting Star | Small body, long upper wick | Bearish | Signals potential reversal in an uptrend |
| Morning Star | Bullish reversal pattern | Bullish | Formed at the bottom of a downtrend |
| Evening Star | Bearish reversal pattern | Bearish | Formed at the top of an uptrend |
| Engulfing | Large candle engulfs previous one | Both | Signals strong market sentiment |
By mastering forex candlestick patterns, traders gain valuable insights into market psychology and can better anticipate price movements. While candlestick patterns are powerful tools, successful trading also requires discipline, sound risk management, and continuous learning. Use this guide as a foundation to enhance your forex trading strategy and seize opportunities in the ever-evolving financial markets.

Leave feedback about this