Forex Review Online
No Result
View All Result
  • Home
  • Crypto
  • Education
  • News
start trading today
  • Home
  • Crypto
  • Education
  • News
No Result
View All Result
Forex Review Online
No Result
View All Result
Home ANALYSIS

The AUDUSD buyers and sellers are battling it out near 2022 highs

A.R Chowdhury by A.R Chowdhury
March 30, 2022
Reading Time: 4 mins read
0
The AUDUSD buyers and sellers are battling it out near 2022 highs

AUDUSD

AUDUSD trade in a narrow trading range

The  AUDUSD 
AUD/USD

The AUD/USD is the currency pair encompassing the Australian dollar of the Commonwealth of Australia (symbol $, code AUD), and the dollar of the United States of America (symbol $, code USD). The pair’s rate indicates how many US dollars are needed in order to purchase one Australian dollar. For example, when the AUD/USD is trading at 0.7500, it means 1 Australian dollar is equivalent to 0.75 US dollars. The Australian dollar (AUD) is the world’s fifth most traded currency, whilst the US Dollar (USD) is the world’s most traded currency, resulting in a very liquid pair, with tight spreads, often staying within the 1 pip to 3 pip spread range on most forex brokers. AUD/USD Popular Among Various Types of TradersA lot of traders consider the AUD/USD to perhaps be the most consistent currency pair with respect to swing trading, as it has often moved in steadfast cycles.Having said that, every pair presents its own challenges for traders.The AUD/USD is very popular with swing traders, with the four-hour timeframe being, historically at least, more dependable than others. Historically the AUD/USD is influenced by interest rate differentials, commodity prices, government credit ratings, and overall sentiment and speculation.

The AUD/USD is the currency pair encompassing the Australian dollar of the Commonwealth of Australia (symbol $, code AUD), and the dollar of the United States of America (symbol $, code USD). The pair’s rate indicates how many US dollars are needed in order to purchase one Australian dollar. For example, when the AUD/USD is trading at 0.7500, it means 1 Australian dollar is equivalent to 0.75 US dollars. The Australian dollar (AUD) is the world’s fifth most traded currency, whilst the US Dollar (USD) is the world’s most traded currency, resulting in a very liquid pair, with tight spreads, often staying within the 1 pip to 3 pip spread range on most forex brokers. AUD/USD Popular Among Various Types of TradersA lot of traders consider the AUD/USD to perhaps be the most consistent currency pair with respect to swing trading, as it has often moved in steadfast cycles.Having said that, every pair presents its own challenges for traders.The AUD/USD is very popular with swing traders, with the four-hour timeframe being, historically at least, more dependable than others. Historically the AUD/USD is influenced by interest rate differentials, commodity prices, government credit ratings, and overall sentiment and speculation.
Read this Term
is trading in a fairly narrow trading range of 33 pips versus 76 PIP average over the last 22 trading days (around month trading).

The confined range is largely a result of technical levels above and below that have buyers and sellers leaning on tests.

RELATED POSTS

EURGBP erases gains and returns to a familiar bias defining level

New highs for US stocks. The Nasdaq continues to lead

USDJPY has 3 key technical levels that have stalled the rally higher today

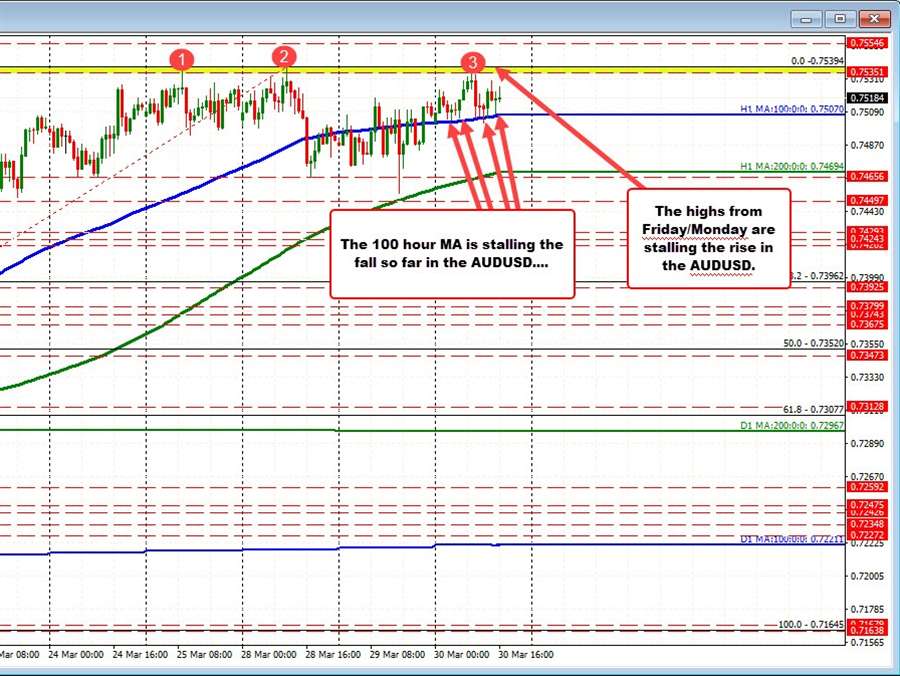
On the topside, the highs from Friday and Monday stalled the pair between 0.7535 and 0.75394. The high price today has reached 0.75349.

On the downside there have been a number of test of its 100 hour moving average currently at 0.7507. The current price is trading at 0.7514

Buyers and sellers are battling it out near the highs from 2022. They are likely looking for the next shove in one direction or the other. In the meantime, the battle rages with no winner one way or the other in trading today.

What happens on a break?

On a break to the upside, the pair would next target levels near 0.75602 (see daily chart below). There is a swing area between the highs this week and that higher extreme (see red numbered circles).

Move above that level and traders would target the 61.8% retracement the move down from the February 2021 high at 0.76094 (see daily chart below).

On the downside, a break of the 100 hour moving average would have traders looking at the 50% midpoint of the range since the 2021 high at 0.74867 (see daily chart below).

Move below that level and the rising 200 hour moving average (green line in the hourly chart above) at 0.7470 would be the next target. A move below that level would be the first break since March 17 and would likely increase the bearish corrective bias.

AUDUSD

AUDUSD on the daily chart
ADVERTISEMENT – CONTINUE READING BELOW

Source link

ShareTweetPin
A.R Chowdhury

A.R Chowdhury

Related Posts

EURGBP erases gains and returns to a familiar bias defining level
ANALYSIS

EURGBP erases gains and returns to a familiar bias defining level

August 14, 2022
New highs for US stocks. The Nasdaq continues to lead
ANALYSIS

New highs for US stocks. The Nasdaq continues to lead

August 14, 2022
USDJPY has 3 key technical levels that have stalled the rally higher today
ANALYSIS

USDJPY has 3 key technical levels that have stalled the rally higher today

August 14, 2022
WTI crude oil futures settle at $92.09
ANALYSIS

WTI crude oil futures settle at $92.09

August 14, 2022
Bitcoin technical analysis, bulls might be giving up soon
ANALYSIS

Bitcoin technical analysis, bulls might be giving up soon

August 14, 2022
The weekend forex technical report for the week of August 15, 2022
ANALYSIS

The weekend forex technical report for the week of August 15, 2022

August 14, 2022
Next Post
USDJPY down for the 2nd consecutive day with 200 hour MA holding support

USDJPY down for the 2nd consecutive day with 200 hour MA holding support

The JPY is the strongest and the USD is the weakest as the NA session begins

The JPY is the strongest and the USD is the weakest as the NA session begins

Leave a Reply Cancel reply

Your email address will not be published. Required fields are marked *

Recommended Stories

WTI crude hits $110 per barrel. What levels to watch for next

WTI crude hits $110 per barrel. What levels to watch for next

March 21, 2022

Gold trades lower on the week

February 27, 2022

USDCHF test the low close going back to 2018

July 24, 2020

Popular Stories

  • The USD is the strongest and the NZD is the weakest as the NA session begins

    0 shares
    Share 0 Tweet 0
  • New highs for US stocks. The Nasdaq continues to lead

    0 shares
    Share 0 Tweet 0
  • EURGBP erases gains and returns to a familiar bias defining level

    0 shares
    Share 0 Tweet 0
  • What is forex and How does it work?

    0 shares
    Share 0 Tweet 0
  • What is CFD trading?

    0 shares
    Share 0 Tweet 0
Forex Review Online

© 2022 My Forex Review - Designed with Jnews Theme.

Navigate Site

  • Home
  • Crypto
  • Education
  • News

Follow Us

No Result
View All Result
  • Home
  • Crypto
  • Education
  • News

© 2022 My Forex Review - Designed with Jnews Theme.