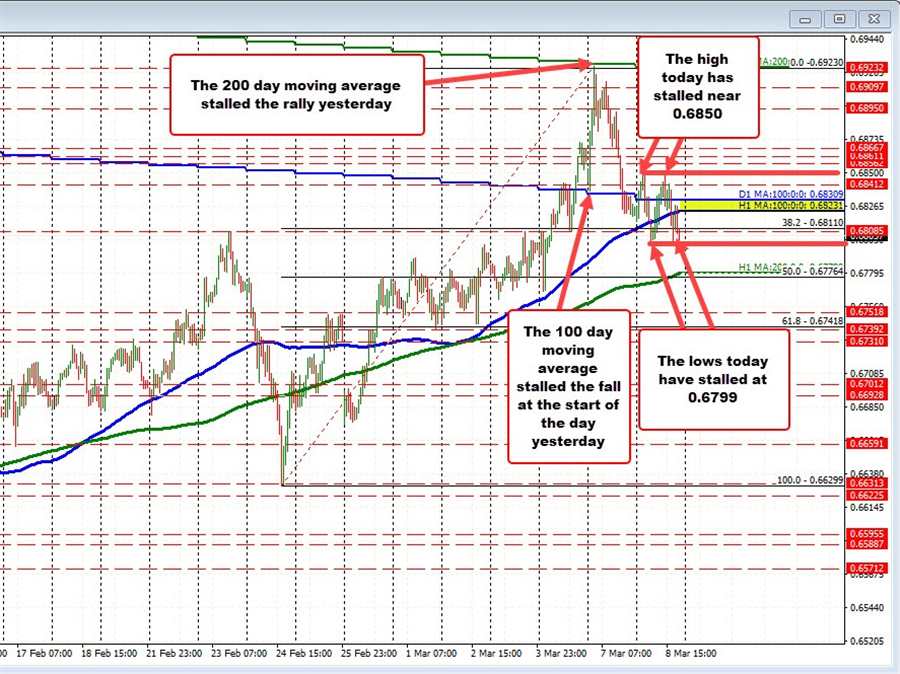
Forex Review Online
No Result
View All Result
  • Home
  • Crypto
  • Education
  • News
start trading today
  • Home
  • Crypto
  • Education
  • News
No Result
View All Result
Forex Review Online
No Result
View All Result
Home ANALYSIS

NZDUSD trade higher lower above and below hourly and daily moving averages today

A.R Chowdhury by A.R Chowdhury
March 8, 2022
Reading Time: 4 mins read
0
NZDUSD trade higher lower above and below hourly and daily moving averages today

NZDUSD

NZDUSD trades within a 50 or so pip trading range today

RELATED POSTS

EURGBP erases gains and returns to a familiar bias defining level

New highs for US stocks. The Nasdaq continues to lead

USDJPY has 3 key technical levels that have stalled the rally higher today

The  NZDUSD 
NZD/USD

The NZD/USD is a commonly offered currency pair representing the New Zealand dollar or Kiwi and US dollar.  The pair is popular for exposure into a commodity currency, i.e. the NZD, which helps capture risk appetite for forex traders. Like its Antipodean counterpart, the Australian Dollar, the NZD/USD is seen as a carry trade, due in part to interest rate differentials which favor the NZD. The NZD is the world’s seventh most liquid pair at the time of writing with the USD being the world’s most traded currency and the NZD being the tenth. What Affects the NZD/USD? The NZD/USD is offered at virtually every retail forex brokerage and is a common pair for traders to have experience with.  The pair moves on investor sentiment and can be much more volatile than other pairs such as the EUR/USD, GBP/USD and others. Given New Zealand is the world’s largest exporter of milk powder, this metric is a key factor when driving the pair. Any sensitivity to milk powder exports is captured via the NZD/USD. Additionally, tourism is a key contributor to the New Zealand economy and as such help move the currency pair.  Other factors of note for the NZD/USD include export volumes to China as well as other important economic data releases from China.  Central banks also play a primary role in the direction of the currency pair with both the US Federal Reserve and the Reserve Bank of New Zealand being closely monitored by investors.  Monetary policy is more than capable of abruptly moving the NZD/USD, which can oscillate much more than other normal pairs.

The NZD/USD is a commonly offered currency pair representing the New Zealand dollar or Kiwi and US dollar.  The pair is popular for exposure into a commodity currency, i.e. the NZD, which helps capture risk appetite for forex traders. Like its Antipodean counterpart, the Australian Dollar, the NZD/USD is seen as a carry trade, due in part to interest rate differentials which favor the NZD. The NZD is the world’s seventh most liquid pair at the time of writing with the USD being the world’s most traded currency and the NZD being the tenth. What Affects the NZD/USD? The NZD/USD is offered at virtually every retail forex brokerage and is a common pair for traders to have experience with.  The pair moves on investor sentiment and can be much more volatile than other pairs such as the EUR/USD, GBP/USD and others. Given New Zealand is the world’s largest exporter of milk powder, this metric is a key factor when driving the pair. Any sensitivity to milk powder exports is captured via the NZD/USD. Additionally, tourism is a key contributor to the New Zealand economy and as such help move the currency pair.  Other factors of note for the NZD/USD include export volumes to China as well as other important economic data releases from China.  Central banks also play a primary role in the direction of the currency pair with both the US Federal Reserve and the Reserve Bank of New Zealand being closely monitored by investors.  Monetary policy is more than capable of abruptly moving the NZD/USD, which can oscillate much more than other normal pairs.
Read this Term
yesterday, based in the early hours of the day against its 100 day moving average and a few hours later was up testing its 200 day moving average up near 0.6924. Both the moving averages did the job. The 100 day moving average held support. The 200 day moving average above stalled the rally and held resistance.

The subsequent fall back to the downside yesterday saw the price move below the 100 day moving average but find support ahead of its 100 hour moving average (lower blue line currently at 0.68231).

Today after the sharp move higher and sharp move lower during yesterday’s trade, the price action was more confined but still up and down.

There were two separate moves to the upside that stalled near 0.6850, and two separate moves to the downside that stalled near 0.6799.

In the process, the price has moved above and below both the 100 hour moving average currently at 0.6823, and the 100 day moving average at 0.68309.

Currently the price is below both those moving averages, and trading back near the low for the day at 0.67988. The low price currently trades at 0.6806.

A move to a new low would have traders targeting the rising 200 hour moving average 0.6779 (the 50% midpoint of the move up from the February 24 low comes in at 0.67764 and that is also a target).

Conversely a move higher and above 0.6850 would open the door for further upside momentum once again. The 200 day moving average at 0.6923 would be the ultimate target on further upside momentum.

ADVERTISEMENT – CONTINUE READING BELOW

Source link

ShareTweetPin
A.R Chowdhury

A.R Chowdhury

Related Posts

EURGBP erases gains and returns to a familiar bias defining level
ANALYSIS

EURGBP erases gains and returns to a familiar bias defining level

August 14, 2022
New highs for US stocks. The Nasdaq continues to lead
ANALYSIS

New highs for US stocks. The Nasdaq continues to lead

August 14, 2022
USDJPY has 3 key technical levels that have stalled the rally higher today
ANALYSIS

USDJPY has 3 key technical levels that have stalled the rally higher today

August 14, 2022
WTI crude oil futures settle at $92.09
ANALYSIS

WTI crude oil futures settle at $92.09

August 14, 2022
Bitcoin technical analysis, bulls might be giving up soon
ANALYSIS

Bitcoin technical analysis, bulls might be giving up soon

August 14, 2022
The weekend forex technical report for the week of August 15, 2022
ANALYSIS

The weekend forex technical report for the week of August 15, 2022

August 14, 2022
Next Post
WTI crude oil futures settle at $123.70

WTI crude oil futures settle at $123.70

The AUDUSD is lower for the 2nd consecutive day and back between 100/200D MAs

The AUDUSD is lower for the 2nd consecutive day and back between 100/200D MAs

Leave a Reply Cancel reply

Your email address will not be published. Required fields are marked *

Recommended Stories

GBPUSD breaks back below the 38.2% retracement on the hourly chart. Extends the narrow trading range

August 31, 2021
USDJPY consolidates in narrow trading range near highest level since January 2017

USDJPY consolidates in narrow trading range near highest level since January 2017

March 16, 2022

USDJPY bounces off 100 hour MA on test

May 20, 2020

Popular Stories

  • New highs for US stocks. The Nasdaq continues to lead

    New highs for US stocks. The Nasdaq continues to lead

    0 shares
    Share 0 Tweet 0
  • The USD is the strongest and the NZD is the weakest as the NA session begins

    0 shares
    Share 0 Tweet 0
  • EURGBP erases gains and returns to a familiar bias defining level

    0 shares
    Share 0 Tweet 0
  • What is forex and How does it work?

    0 shares
    Share 0 Tweet 0
  • Bitcoin technical analysis, bulls might be giving up soon

    0 shares
    Share 0 Tweet 0
Forex Review Online

© 2022 My Forex Review - Designed with Jnews Theme.

Navigate Site

  • Home
  • Crypto
  • Education
  • News

Follow Us

No Result
View All Result
  • Home
  • Crypto
  • Education
  • News

© 2022 My Forex Review - Designed with Jnews Theme.