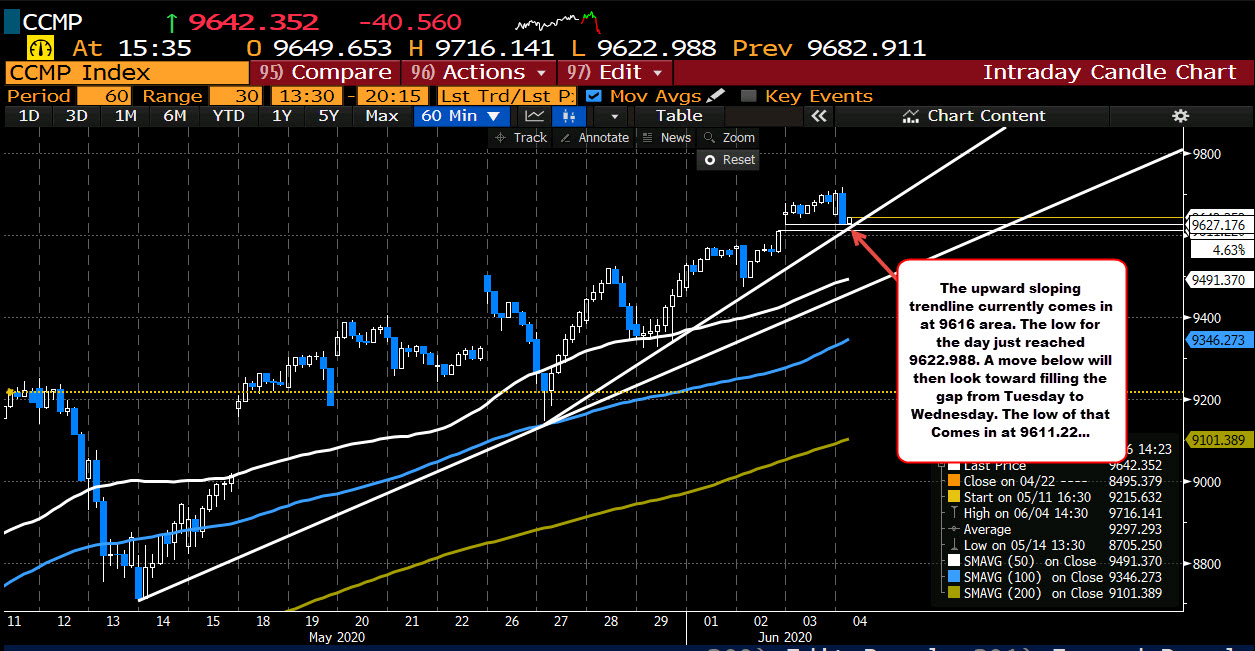
Looks to test hourly trend line
The Nasdaq index moved to the highest level since, but has taken a turn back to the downside in the last hour and in the process looks to test day trend line on the hourly chart at 9616 area. The low for the day just reached 9622.988.

Just below that level is the gap from Tuesday to Wednesday. That gap ranges between 9611.22 and 9627.176. A move below that level would also increase the shorter term bearish bias and weaken some of the bullishness seen over the last few days.
On further downside momentum, the 50 hour moving average at 9491.33 (and moving higher) is still a bit a ways from the current levels.
Price action remains volatile, and the corrective move lower is still just a corrective move lower to support. However, should support giveway, we could start to see more downside probing.


