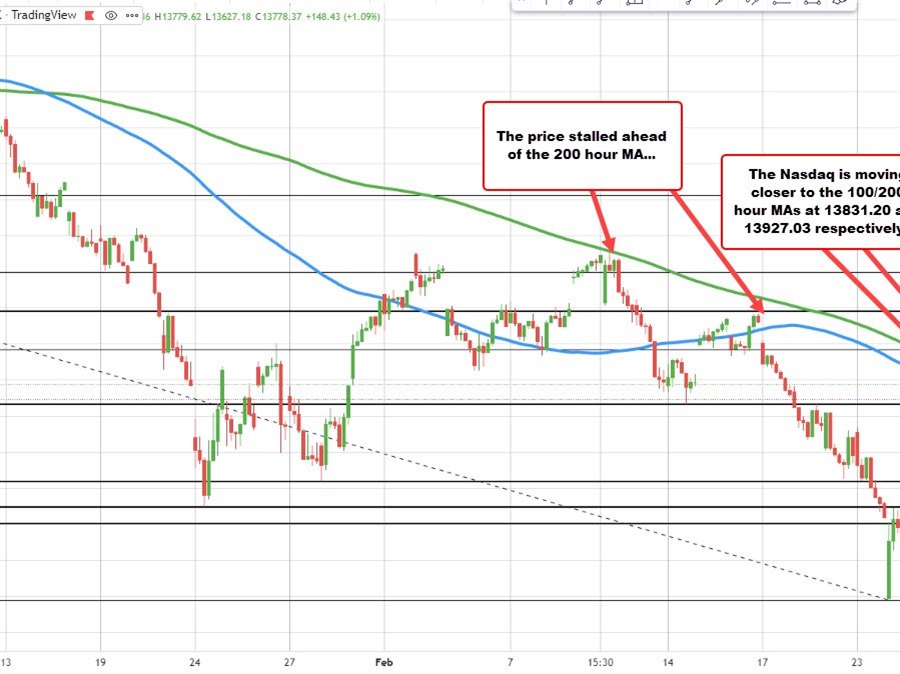

Looking at the hourly chart above, the price is approaching its 100 hour MA at 13831.16. The 200 hour MA is at 13927.01. Recall from the last two weeks, the highs have found sellers ahead of the 200 hour MA (green line). A move above it would increase the bullish bias.
Meanwhile, the S&P and Dow remain down on the day but well off their intraday lows.
- The Dow is down -148 points or -0.44% at 33911
- S&P is down -4 points or -0.09% at 4380.
ADVERTISEMENT – CONTINUE READING BELOW


