Forex Review Online
No Result
View All Result
  • Home
  • Crypto
  • Education
  • News
start trading today
  • Home
  • Crypto
  • Education
  • News
No Result
View All Result
Forex Review Online
No Result
View All Result
Home ANALYSIS

Gold makes another run to the 200 MA on 4-hour chart and bounces

A.R Chowdhury by A.R Chowdhury
March 22, 2022
Reading Time: 1 min read
0
Gold makes another run to the 200 MA on 4-hour chart and bounces

Gold

Gold retest its 200 bar moving average on 4-hour chart

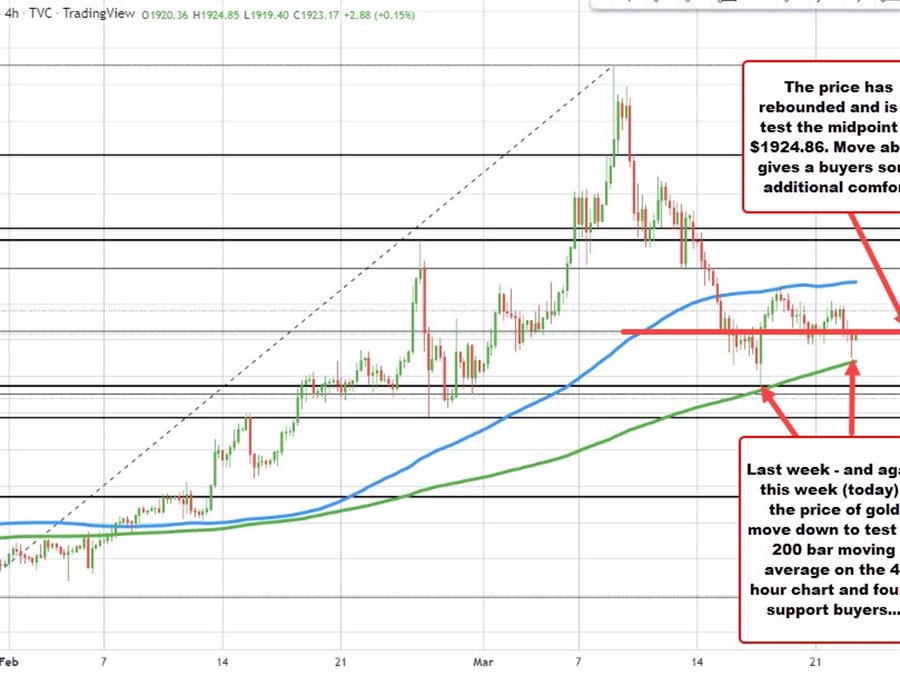
For the 2nd week in a row, the price of gold has seen a move down toward the 200 bar MA on the 4-hour chart and found willing buyers (see green line in the chart above).

The move lower today reached $1910.82. The 200 bar moving averages currently at $1908.02.

The price is currently trading at $1923.50 which is still down $-12.24 or -0.63% on the day. The last two bars have retested the 50% midpoint of the move up from the January 28 below at $1924.86. A move above would give the dip buyers more confidence/comfort and tilt the bias little more in favor of the buyers as the price waffles between the 100 bar MA above (blue line at $1951.54) and the 200 bar MA below (green line at $1908.02).

The flight into the safety of the Gold has declined, although inflation continued to push higher. Higher rates though can have a dampening effect on gold as well.

ADVERTISEMENT – CONTINUE READING BELOW

Source link

RELATED POSTS

EURGBP erases gains and returns to a familiar bias defining level

New highs for US stocks. The Nasdaq continues to lead

USDJPY has 3 key technical levels that have stalled the rally higher today

ShareTweetPin
A.R Chowdhury

A.R Chowdhury

Related Posts

EURGBP erases gains and returns to a familiar bias defining level
ANALYSIS

EURGBP erases gains and returns to a familiar bias defining level

August 14, 2022
New highs for US stocks. The Nasdaq continues to lead
ANALYSIS

New highs for US stocks. The Nasdaq continues to lead

August 14, 2022
USDJPY has 3 key technical levels that have stalled the rally higher today
ANALYSIS

USDJPY has 3 key technical levels that have stalled the rally higher today

August 14, 2022
WTI crude oil futures settle at $92.09
ANALYSIS

WTI crude oil futures settle at $92.09

August 14, 2022
Bitcoin technical analysis, bulls might be giving up soon
ANALYSIS

Bitcoin technical analysis, bulls might be giving up soon

August 14, 2022
The weekend forex technical report for the week of August 15, 2022
ANALYSIS

The weekend forex technical report for the week of August 15, 2022

August 14, 2022
Next Post
GBPJPY trades to the highest level since June 2016

GBPJPY trades to the highest level since June 2016

The USD is the strongest and the EUR is the weakest as the NA session begins

The USD is the strongest and the EUR is the weakest as the NA session begins

Leave a Reply Cancel reply

Your email address will not be published. Required fields are marked *

Recommended Stories

EUR/USD needs to keep break of 1.15 to shift to higher range

July 22, 2020
Major indices are now all down on the day

Major indices are now all down on the day

September 10, 2021

Gold rebounds higher and makes new session highs

June 19, 2020

Popular Stories

  • The USD is the strongest and the NZD is the weakest as the NA session begins

    0 shares
    Share 0 Tweet 0
  • New highs for US stocks. The Nasdaq continues to lead

    0 shares
    Share 0 Tweet 0
  • EURGBP erases gains and returns to a familiar bias defining level

    0 shares
    Share 0 Tweet 0
  • What is forex and How does it work?

    0 shares
    Share 0 Tweet 0
  • What is CFD trading?

    0 shares
    Share 0 Tweet 0
Forex Review Online

© 2022 My Forex Review - Designed with Jnews Theme.

Navigate Site

  • Home
  • Crypto
  • Education
  • News

Follow Us

No Result
View All Result
  • Home
  • Crypto
  • Education
  • News

© 2022 My Forex Review - Designed with Jnews Theme.