Forex Review Online
No Result
View All Result
  • Home
  • Crypto
  • Education
  • News
start trading today
  • Home
  • Crypto
  • Education
  • News
No Result
View All Result
Forex Review Online
No Result
View All Result
Home ANALYSIS

GBPUSD trades to new highs

A.R Chowdhury by A.R Chowdhury
September 15, 2021
Reading Time: 2 mins read
0
GBPUSD trades to new highs

The pair fell sharply yesterday but swings higher today

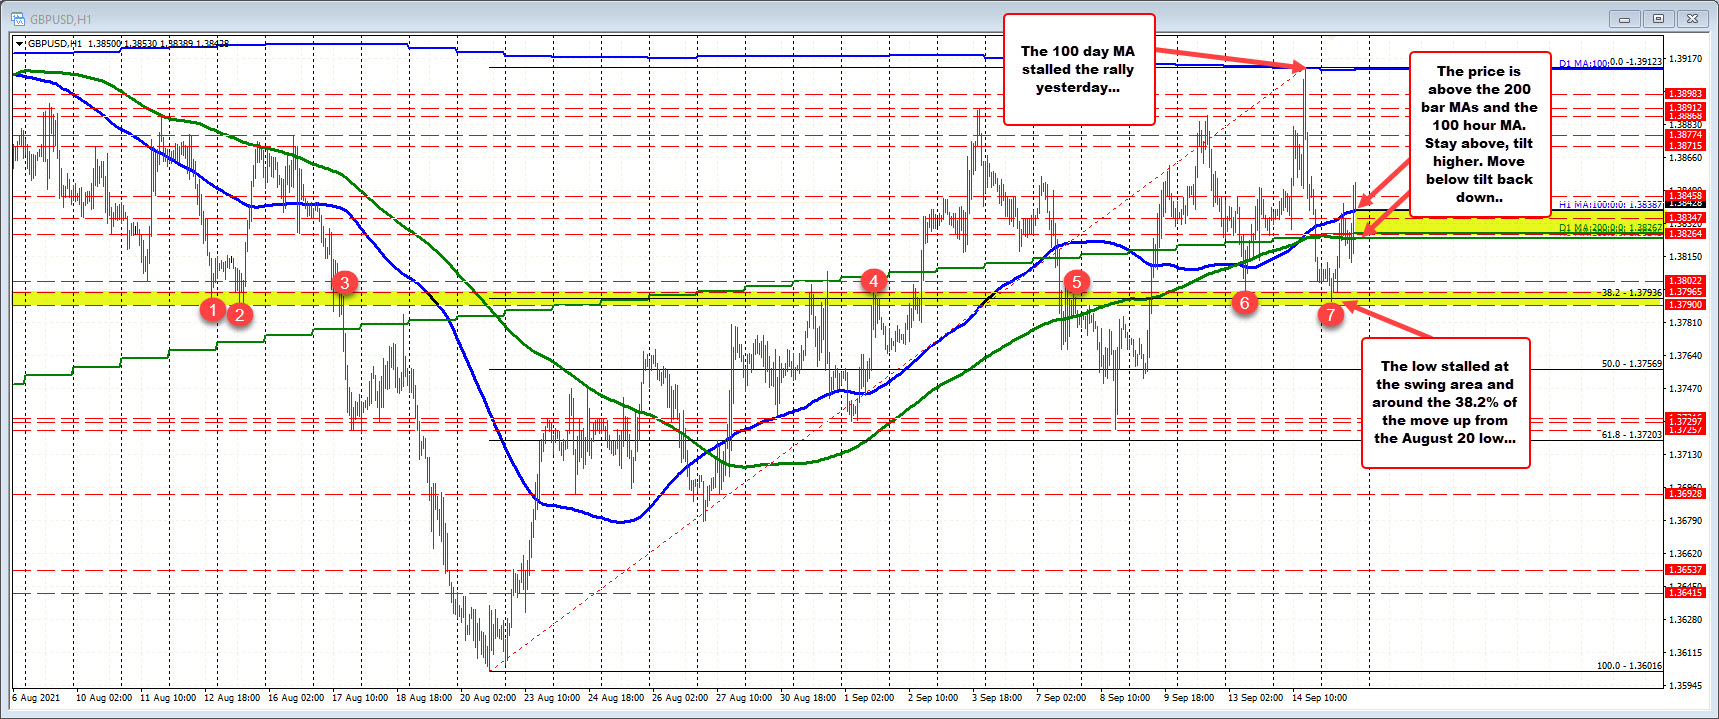
The GBPUSD moved higher to test it’s 100 day MA yesterday at 1.3912 and found sellers against the key level.  A move back into the dollar on risk off flows (into the JPY, CHF and lesser extent, the USD) helped to push the pair away from that key MA as well.  

The pair fell sharply yesterday but swings higher today

The selling yesterday, snowballed with persistent selling that saw the pair fall below the 100/200 hour MAs and 200 day MA in the US afternoon session. The low stalled near a swing area between 1.3790 and 1.37965 (see red numbered circles). The 38.2% of the move up from the August 20 low was also in that area.  

The price action today has seen a rotation back higher (albeit with some ups and downs) in and around the aforementioned MAs. The price has moved above 100 hour MA (the highest MA level) at 1.38387. Traders are trying to stay above that level, but a break back lower can not be ruled out.  The 200 hour MA and 200 day MA are at 1.3875 area. Move below those MA levels and the bears would be back in control technically and the buyers and sellers continue to fight it out.

Yesterday, I did a post of the 5 minute chart (see post here). The price correction yesterday of the initial move lower stalled right at the 200 bar MA and reversed lower (see green line in the 5 minute chart below).  

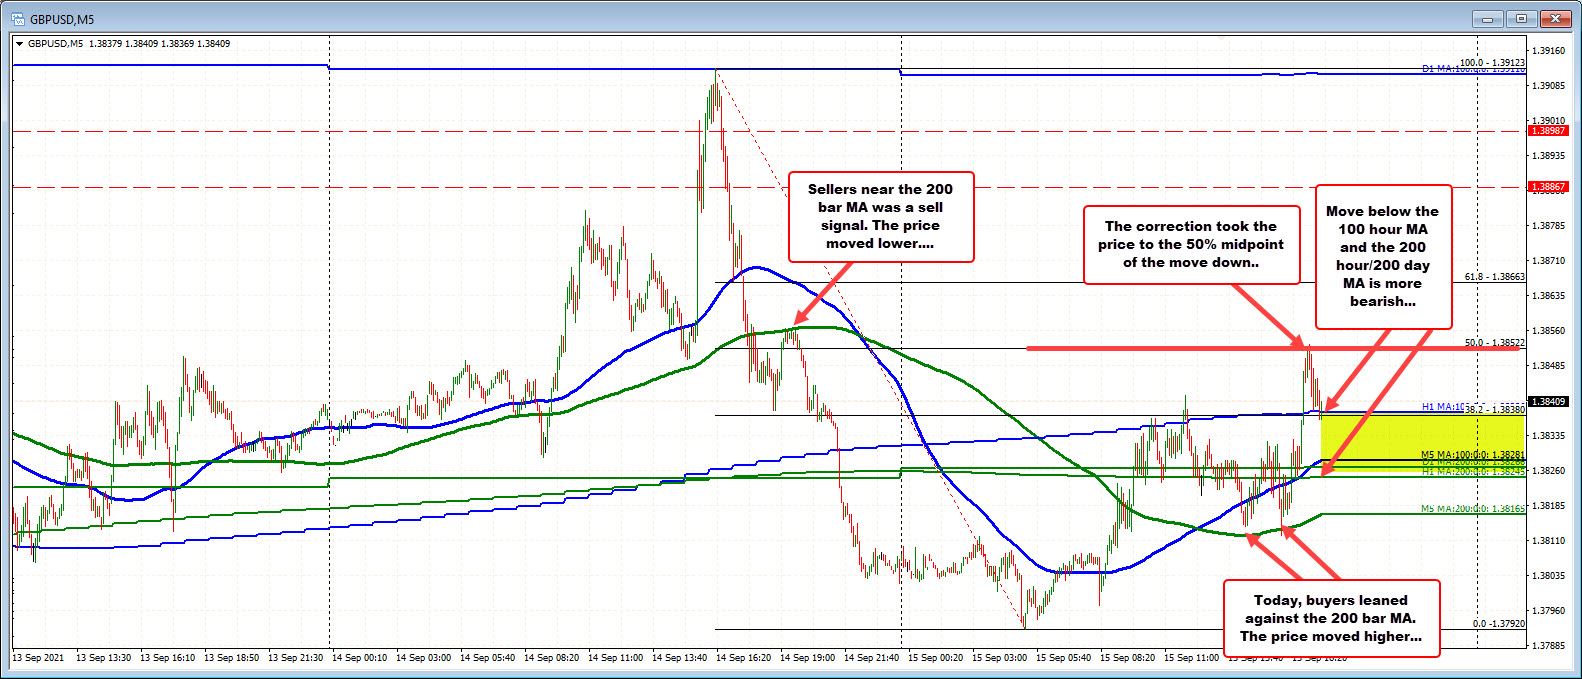
Today, after reaching a new low into support on the hourly, the price moved back above the 100/200  bar MAs on the 5 minute chart which weakened the sellers. On the dip in early US trading, the  buyers leaned this time against the 200 bar MA (green line), and moved higher.  

The move to the highs today, have moved up to test the 50% midpoint of the run lower at 1.38522. That is a good place to stall the rally.  It at least sets a risk defining level that if breached would be more bullish today.  

If the sellers do reenter (with the 50% as the ceiling), moving below the 100 hour MA, the 200 hour and 200 day MA would be the next steps…..

GBPYSD on the 5 minute chart.

Invest in yourself. See our forex education hub.

Source link

RELATED POSTS

EURGBP erases gains and returns to a familiar bias defining level

New highs for US stocks. The Nasdaq continues to lead

USDJPY has 3 key technical levels that have stalled the rally higher today

ShareTweetPin
A.R Chowdhury

A.R Chowdhury

Related Posts

EURGBP erases gains and returns to a familiar bias defining level
ANALYSIS

EURGBP erases gains and returns to a familiar bias defining level

August 14, 2022
New highs for US stocks. The Nasdaq continues to lead
ANALYSIS

New highs for US stocks. The Nasdaq continues to lead

August 14, 2022
USDJPY has 3 key technical levels that have stalled the rally higher today
ANALYSIS

USDJPY has 3 key technical levels that have stalled the rally higher today

August 14, 2022
WTI crude oil futures settle at $92.09
ANALYSIS

WTI crude oil futures settle at $92.09

August 14, 2022
Bitcoin technical analysis, bulls might be giving up soon
ANALYSIS

Bitcoin technical analysis, bulls might be giving up soon

August 14, 2022
The weekend forex technical report for the week of August 15, 2022
ANALYSIS

The weekend forex technical report for the week of August 15, 2022

August 14, 2022
Next Post
EURUSD trading up and down. Back below its 100 hour moving average

EURUSD trading up and down. Back below its 100 hour moving average

The USDJPY bounces off the mid August swing lows

The USDJPY bounces off the mid August swing lows

Leave a Reply Cancel reply

Your email address will not be published. Required fields are marked *

Recommended Stories

WTI crude oil futures settle at $38.28

WTI crude oil futures settle at $38.28

September 15, 2020
The yield curve stays at flattest since 2020. What is that telling us?

The yield curve stays at flattest since 2020. What is that telling us?

March 21, 2022

GBPUSD waffles below the 100 hour MA

April 5, 2022

Popular Stories

  • The USD is the strongest and the NZD is the weakest as the NA session begins

    0 shares
    Share 0 Tweet 0
  • EURGBP erases gains and returns to a familiar bias defining level

    0 shares
    Share 0 Tweet 0
  • New highs for US stocks. The Nasdaq continues to lead

    0 shares
    Share 0 Tweet 0
  • What is forex and How does it work?

    0 shares
    Share 0 Tweet 0
  • What is CFD trading?

    0 shares
    Share 0 Tweet 0
Forex Review Online

© 2022 My Forex Review - Designed with Jnews Theme.

Navigate Site

  • Home
  • Crypto
  • Education
  • News

Follow Us

No Result
View All Result
  • Home
  • Crypto
  • Education
  • News

© 2022 My Forex Review - Designed with Jnews Theme.