Swing lows going back to February 2020
The EURUSD on the daily chart, has had a number of swing lows come in the area of 1.0766 to 1.0777 area (see red numbered circles on the daily chart below). The price low
has moved to test the topside of that range.
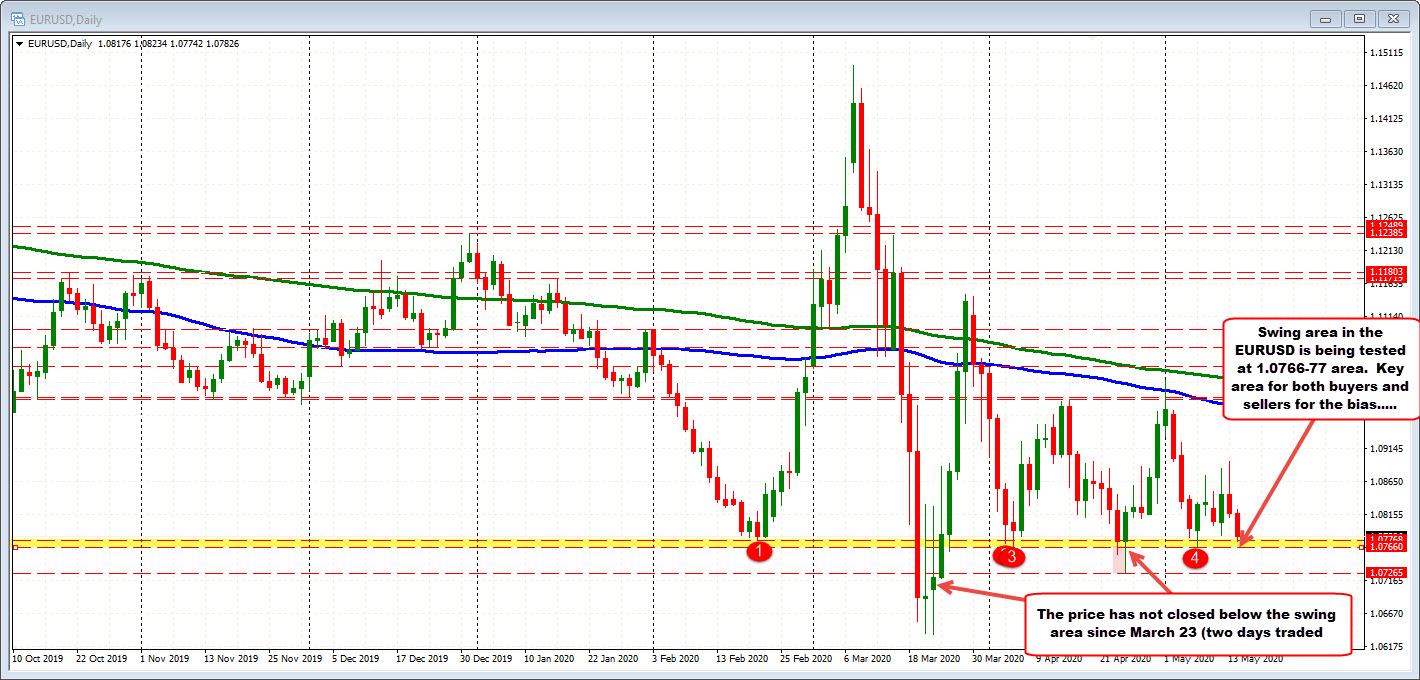
The area represents a key level for both buyers and sellers. Risk focus traders may look to sick a toe in the water against the level with hopes of a rebound (with a stop below). Sellers who have been more dominant since the peak yesterday, want to see that area broken and remain broken. 8 daily bar has not close below the level since March 23 (although there was a move below on April 23 and April 24).
Drilling to the hourly chart, the swing high price from yesterday stalled near a swing area between 1.0886 – 96 along with the 50% retracement of the move down from the May 1 high to the May 7 low (at 1.0892). Since then the price action has seen a decay through the it’s 200 hour moving average (green line), 100 hour moving average (blue line). And in today’s trading the price fell below a upward sloping trendline and a swing area near 1.0781 – 84.
That last area has seen consolidation above and below as the daily support comes into play. Traders are showing some apprehension as a key support area is tested.


