EURGBP is in play today
The EURGBP saw basing against its 200 hour moving average over the last four or so trading days (see green line in the chart below). However, there is also been a ceiling near its 100 day moving average (higher blue line at 0.8583).
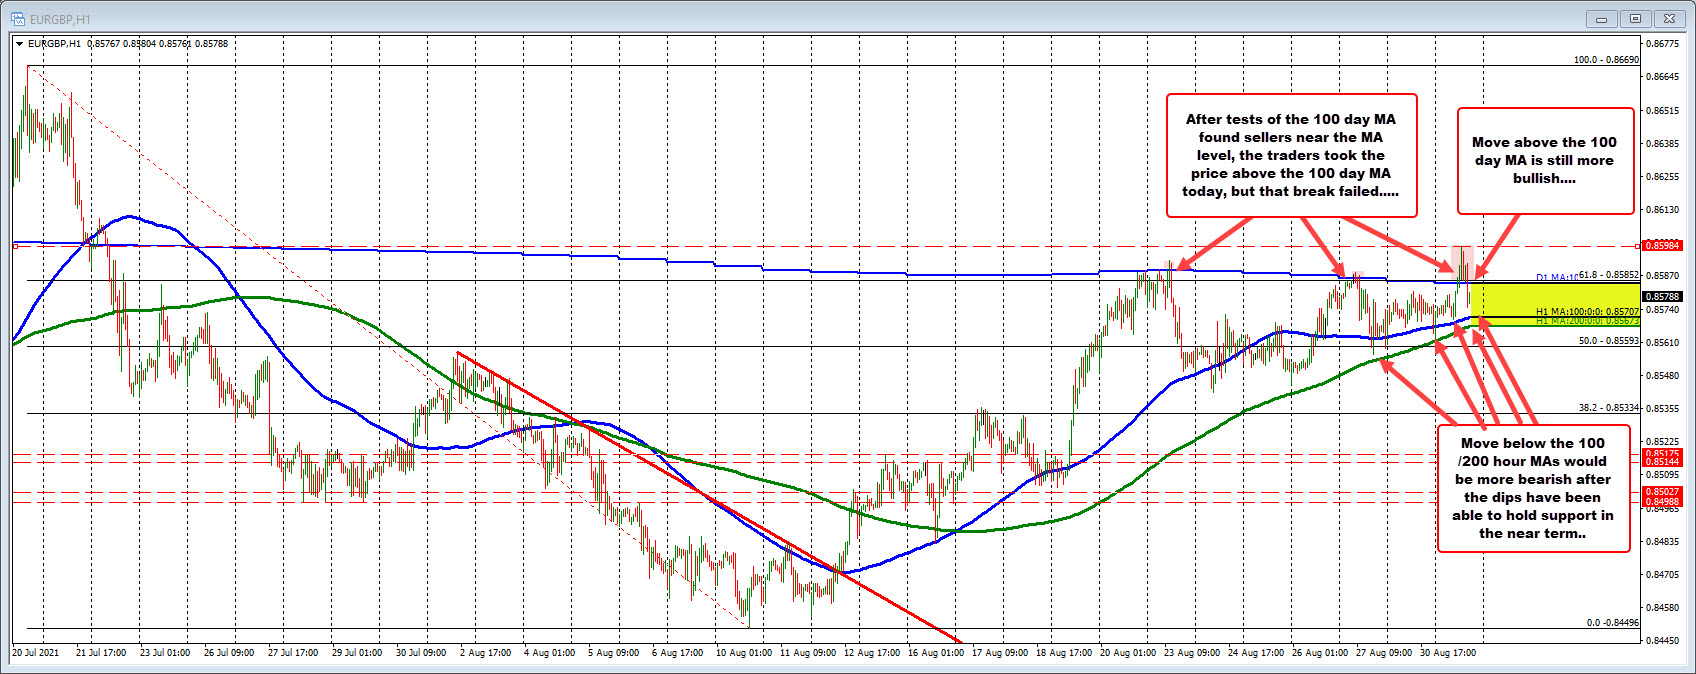
Going back to August 19 and August 20, the pair tested the 100 day moving average line (it did move briefly above it on August 20), and fell off on each test.
On Friday, the price also tested the 100 day moving average (and briefly moved above) and backed off again.
Today, after holding the 200 hour moving average below and basing against its 100 hour moving average as well (lower blue line), buyers made a play above the 100 day MA at 0.85838. The high price extended to 0.8594.
However, the momentum faded, and the price over the last hour has seen a move back below the 100 day moving average. Failed break. Buyers had their shot.
What now?
It is month end and that can influence price action, but technically speaking, the hourly moving averages below and the daily moving average above are starting to converge and in doing so may force traders to finally push outside the extremes.
The buyers did have their shot. That failure favors the sellers. However, there still can be a re-break higher. Getting back above the 100 day MA would still be a bullish play. Watch that level above now.
On the downside, breaking below the 100 and 200 hour moving averages between 0.85673 and 0.85707 would increase the bearish bias with a break of the 50% midpoint of the range since July 20 high at 0.85593 as a bearish confirmation.


