Forex Review Online
No Result
View All Result
  • Home
  • Crypto
  • Education
  • News
start trading today
  • Home
  • Crypto
  • Education
  • News
No Result
View All Result
Forex Review Online
No Result
View All Result
Home ANALYSIS

Dow down 700 points. Nasdaq down over 400 points. S&P tests its 100 day moving average

A.R Chowdhury by A.R Chowdhury
September 20, 2021
Reading Time: 1 min read
0
Dow down 700 points. Nasdaq down over 400 points. S&P tests its 100 day moving average

Major indices getting hammered

The major US stock indices continue to get hammered with the Dow down over 700 points.  The S&P index down nearly 100 points and the NASDAQ index down over 400 points.

Major indices getting hammered_

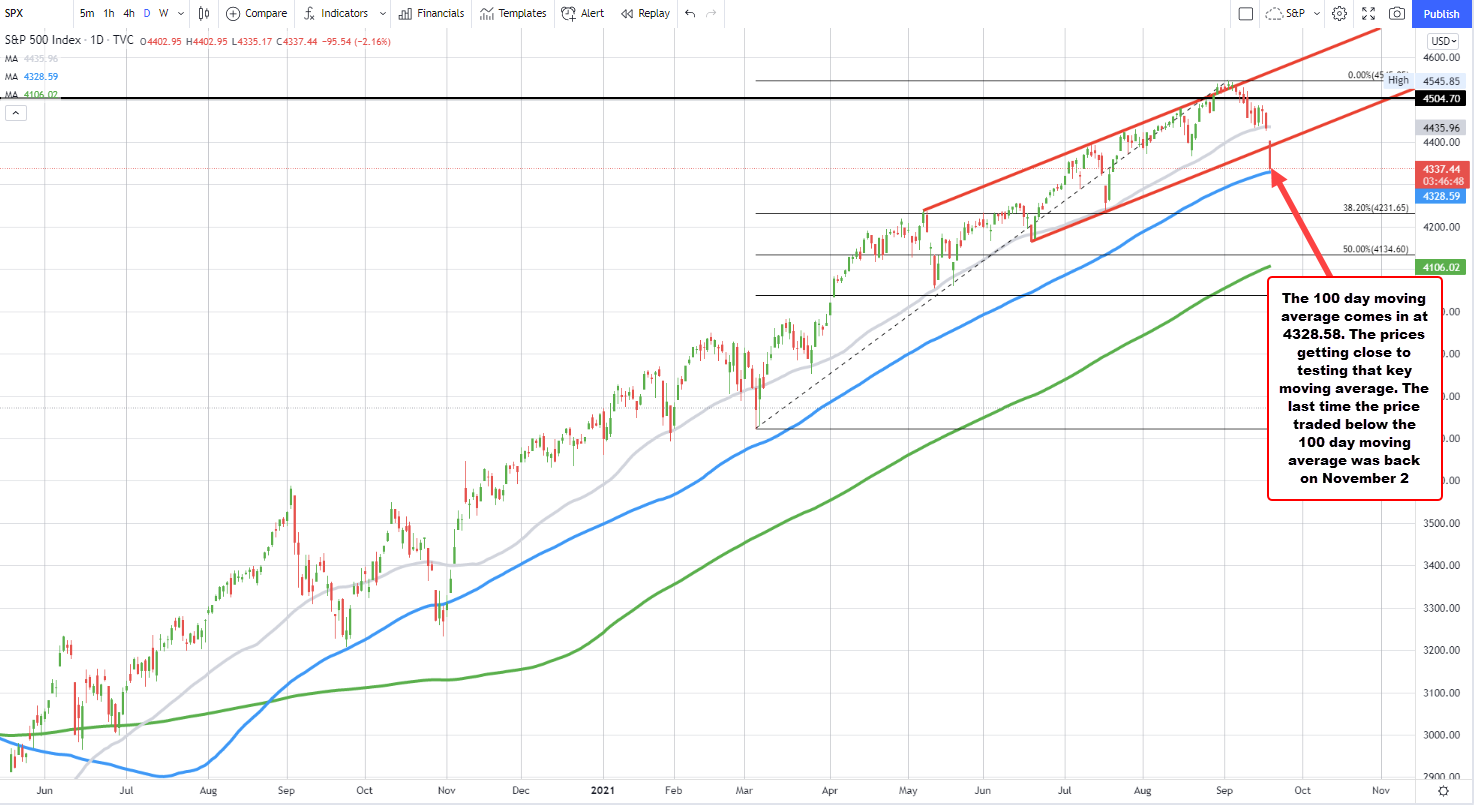
Taking a look at the S&P on the daily chart above, the price has moved down to test its 100 day moving average. That moving average currently comes in at 4328.57. The low price for the day has reached 4335.17. So the price is within six – seven points of that key moving average line. The price of the S&P index has not traded below its 100 day moving average since November 2, 2020.

Source link

RELATED POSTS

EURGBP erases gains and returns to a familiar bias defining level

New highs for US stocks. The Nasdaq continues to lead

USDJPY has 3 key technical levels that have stalled the rally higher today

ShareTweetPin
A.R Chowdhury

A.R Chowdhury

Related Posts

EURGBP erases gains and returns to a familiar bias defining level
ANALYSIS

EURGBP erases gains and returns to a familiar bias defining level

August 14, 2022
New highs for US stocks. The Nasdaq continues to lead
ANALYSIS

New highs for US stocks. The Nasdaq continues to lead

August 14, 2022
USDJPY has 3 key technical levels that have stalled the rally higher today
ANALYSIS

USDJPY has 3 key technical levels that have stalled the rally higher today

August 14, 2022
WTI crude oil futures settle at $92.09
ANALYSIS

WTI crude oil futures settle at $92.09

August 14, 2022
Bitcoin technical analysis, bulls might be giving up soon
ANALYSIS

Bitcoin technical analysis, bulls might be giving up soon

August 14, 2022
The weekend forex technical report for the week of August 15, 2022
ANALYSIS

The weekend forex technical report for the week of August 15, 2022

August 14, 2022
Next Post
Cable hits new lows as sentiment deteriorates further

Cable hits new lows as sentiment deteriorates further

S&P 500 falls below the 100-day moving average for the first time since October

S&P 500 falls below the 100-day moving average for the first time since October

Leave a Reply Cancel reply

Your email address will not be published. Required fields are marked *

Recommended Stories

US 10 year yield moves to a new cycle high and highest level since July 2019

US 10 year yield moves to a new cycle high and highest level since July 2019

March 14, 2022
USDCAD runs above 100 hour MA as oil takes a tumble

USDCAD runs above 100 hour MA as oil takes a tumble

March 28, 2022

USDJPY reverse higher. Trading waters become more murky.

May 1, 2020

Popular Stories

  • The USD is the strongest and the NZD is the weakest as the NA session begins

    0 shares
    Share 0 Tweet 0
  • EURGBP erases gains and returns to a familiar bias defining level

    0 shares
    Share 0 Tweet 0
  • New highs for US stocks. The Nasdaq continues to lead

    0 shares
    Share 0 Tweet 0
  • What is forex and How does it work?

    0 shares
    Share 0 Tweet 0
  • What is CFD trading?

    0 shares
    Share 0 Tweet 0
Forex Review Online

© 2022 My Forex Review - Designed with Jnews Theme.

Navigate Site

  • Home
  • Crypto
  • Education
  • News

Follow Us

No Result
View All Result
  • Home
  • Crypto
  • Education
  • News

© 2022 My Forex Review - Designed with Jnews Theme.