
The dollar may have recovered some ground yesterday but the weeks ahead may prove to be more challenging
I’m not a big fan of the dollar index (DXY) in general and if looking at the relative strength of the greenback, I tend to follow the Bloomberg dollar index (BBDXY) more closely.
But amid the pullback in the dollar yesterday, it is bringing about an interesting technical level on the dollar index (DXY) chart and perhaps that is something to watch:
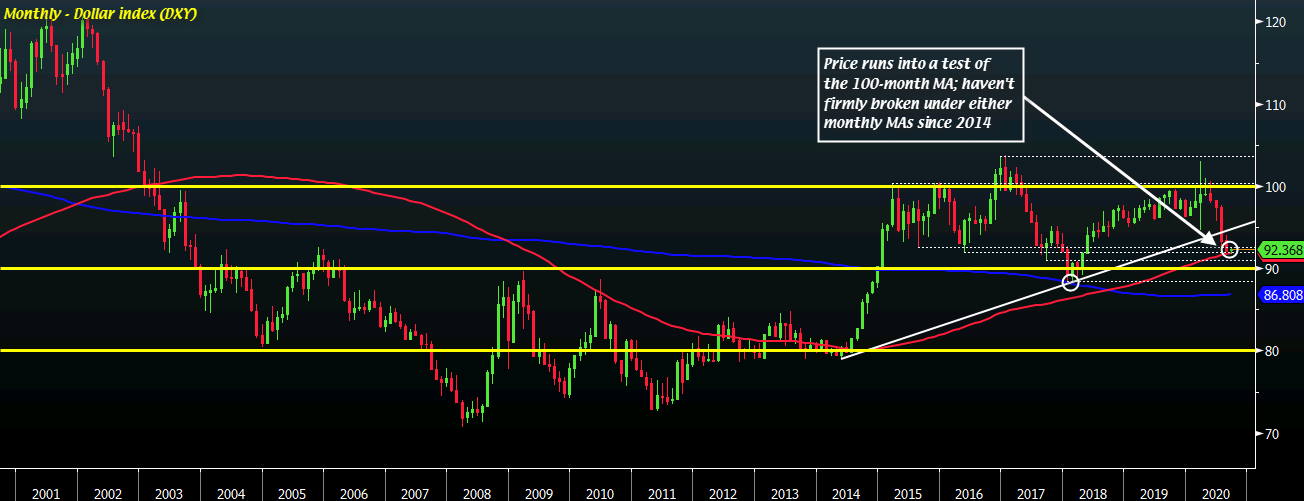
The dollar began the week on weaker footing but staged a bit of a rebound yesterday, with price action testing the 100-month MA (red line) in the dollar index (DXY).
Of note, price has not firmly broken under either of its key monthly moving averages since 2014. In short, this represents a key technical test for the dollar.
Now, one of the reasons why I don’t quite fancy the dollar index (DXY) is that it is a major reflection of EUR/USD due to the way it is weighted. Let’s take a look:
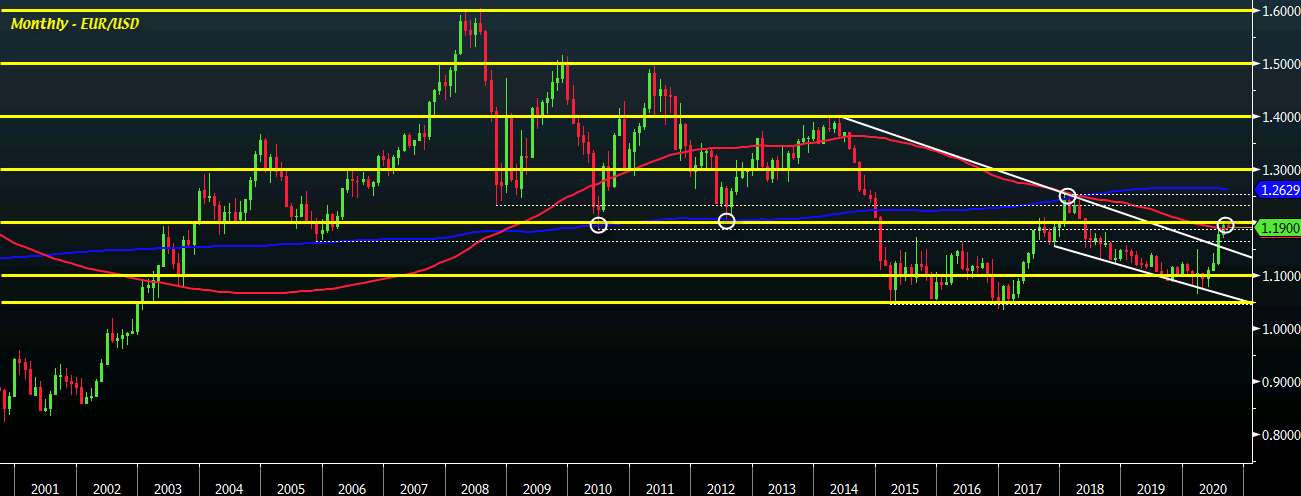
The general trend in both charts are pretty much the same and we can also see EUR/USD at around its 100-month MA (red line) but in this instance, it is trading above that after the August close breached the key technical level.
That level is now seen @ 1.1867 and keeping above that should solidify the bullish momentum by buyers over the past few months of trading.
The theme of dollar weakness may be one that could span for many more years to come as the Fed has sent a strong message last week to stay ahead in the race to the bottom.


