What are the technical’s saying for the major currencies.
EURUSD: The EURUSD extended the week’s trading range in the NY afternoon (taking out the low from Tuesday at 1.12402. The break took the price to the 38.2% of the move up from the May 25 low. That level comes in at 1.12105.
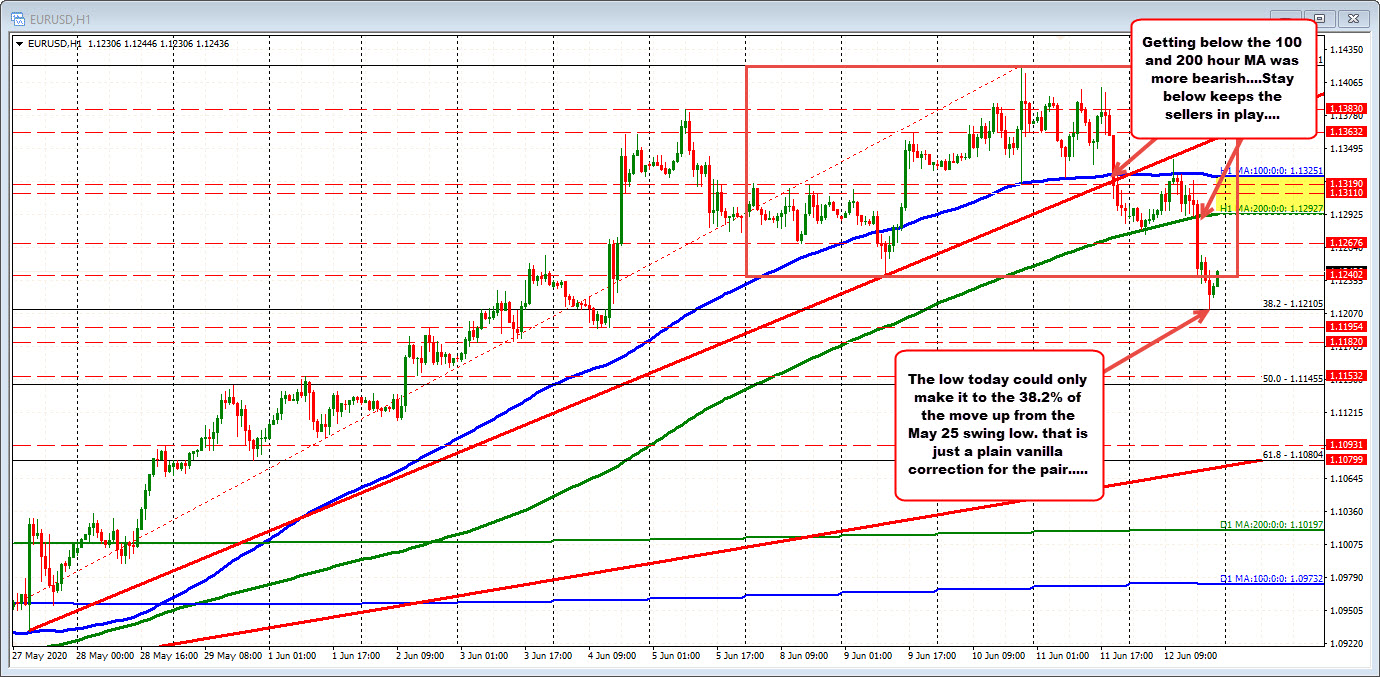
The high for the week reached 1.1421.
The price decline on Thursday and Friday, took the price back below the 100 hour MA at 1.1325 and the 200 hour MA at 1.12927. Into the new trading week, staying below each of those levels would keep the sellers in play.
What is in the favor of the buyers is that the correction this week could only get to the 38.2% retracement. That is just a plain vanilla correction. It will take a move below that level to give sellers more confidence and more control.
USDJPY: The USDJPY trended to the downside with the high for the week on Monday, and the double bottom low yesterday and today (today was a pip higher but close enough).
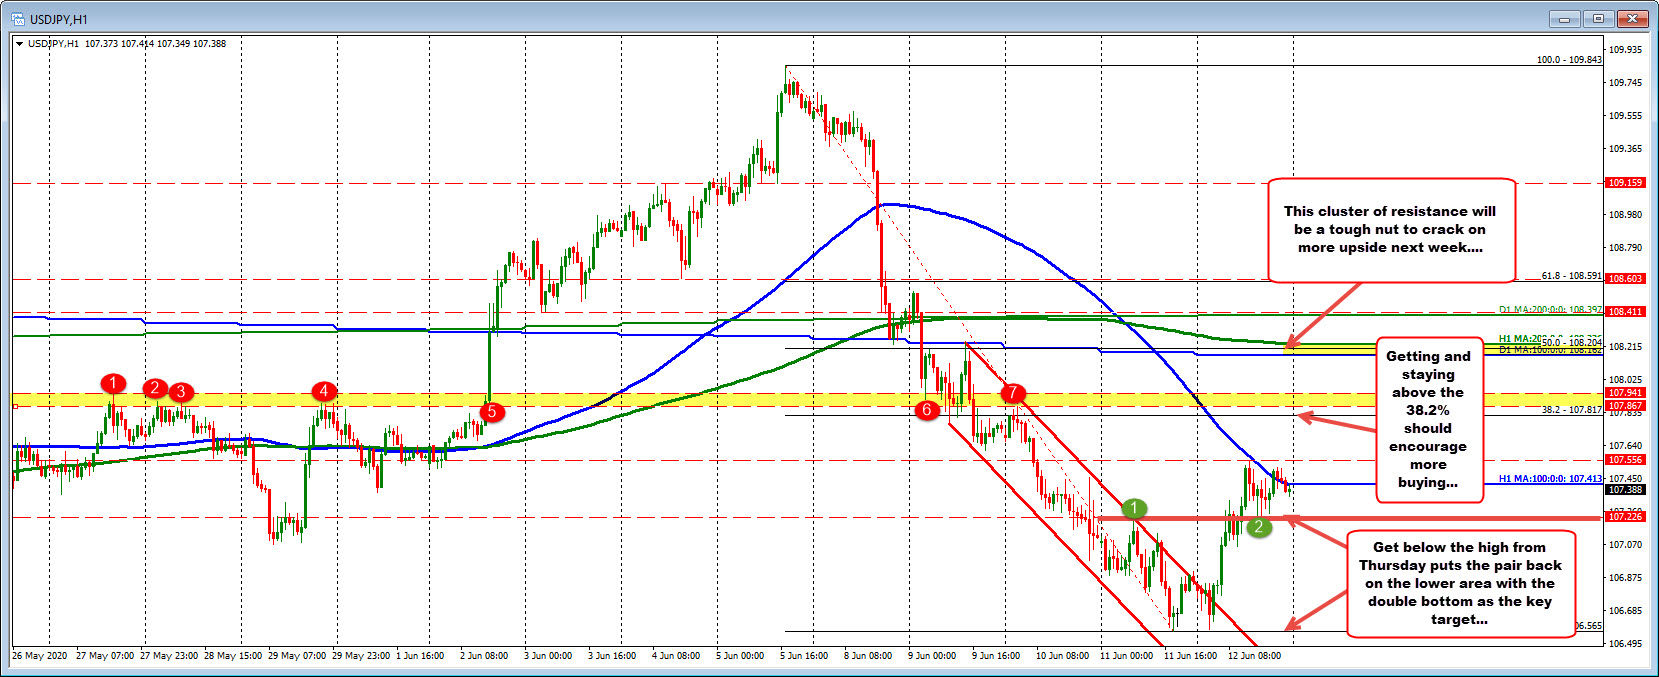
The move higher today on the hourly chart above, moved above the high from yesterday at 107.226, and held that level on a NY correction lower. The price, however, could not muster much momentum above the falling 100 hour MA (blue line currently at 107.423). The price closed the week near that MA level.
In the new trading week, the 100 hour MA will be the bias barometer for the buyers and the sellers. Move above is more bullish. Move below and the sellers are more in control.
On the topside, getting above the 38.2% of the move down this week at 107.817 is the first – and minimum target to get to and through if the buyers are to take back more control. Above that and the cluster including the 100 day MA at 108.18, the 50% retracement at 108.20 and the 200 hour MA (moving lower) at 108. 226 area upside targets make for a formidable resistance area.
On the downside, falling below the 107.22 should open the door for a potential return to the double bottom at 106.56.
GBPUSD: The GBPUSD traded at it’s lowest level for the week on Friday and in the process moved away from its 200 hour MA at 1.26425 (green line) and also cracked below its 100 day MA.
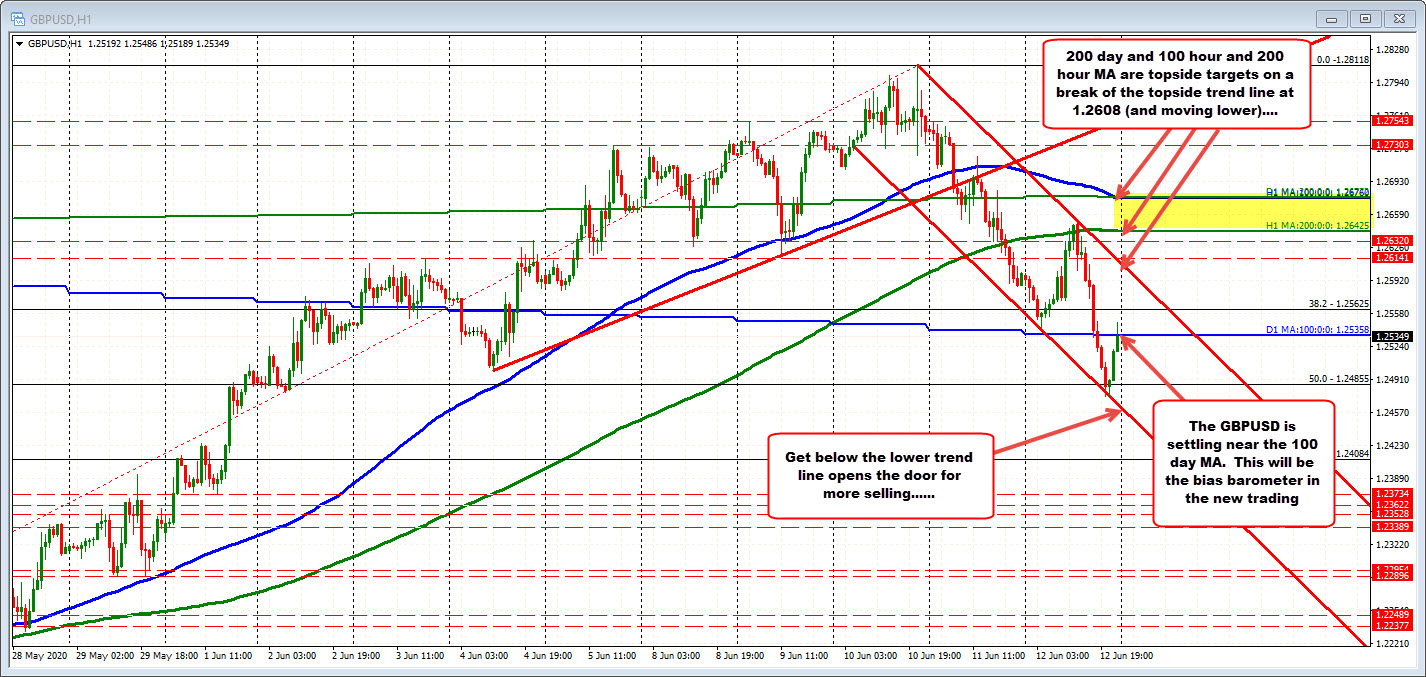
However, a channel lower trend line stalled the fall and the price rebounded back above the 100 day MA by the close – but only by a few pips.
Trading above and below the 100 day MA will make that MA the bias barometer in the new trading week. Above is more bullish. Below is more bearish.
On more upside, the topside channel trend line cuts across at 1.2608 and moving lower. Above that, the 200 hour MA at 1.2642 and the 100 hour MA AND 200 day MA both at 1.2676 (the 100 hour MA is moving lower though) would be eyed.
On more weakness (PS the economic data on Friday was horrendous in the UK), the 50% at 1.24855 followed by the lower channel trend line (and moving lower) at 1.2459 would be targeted….
USDCHF: The USDCHF peaked on Monday at 0.9638. That was above it’s 200 hour MA (green line), but the momentum could not be sustained and pair trended down to the a low at 0.93753 helped by weakening stocks and lower yields.
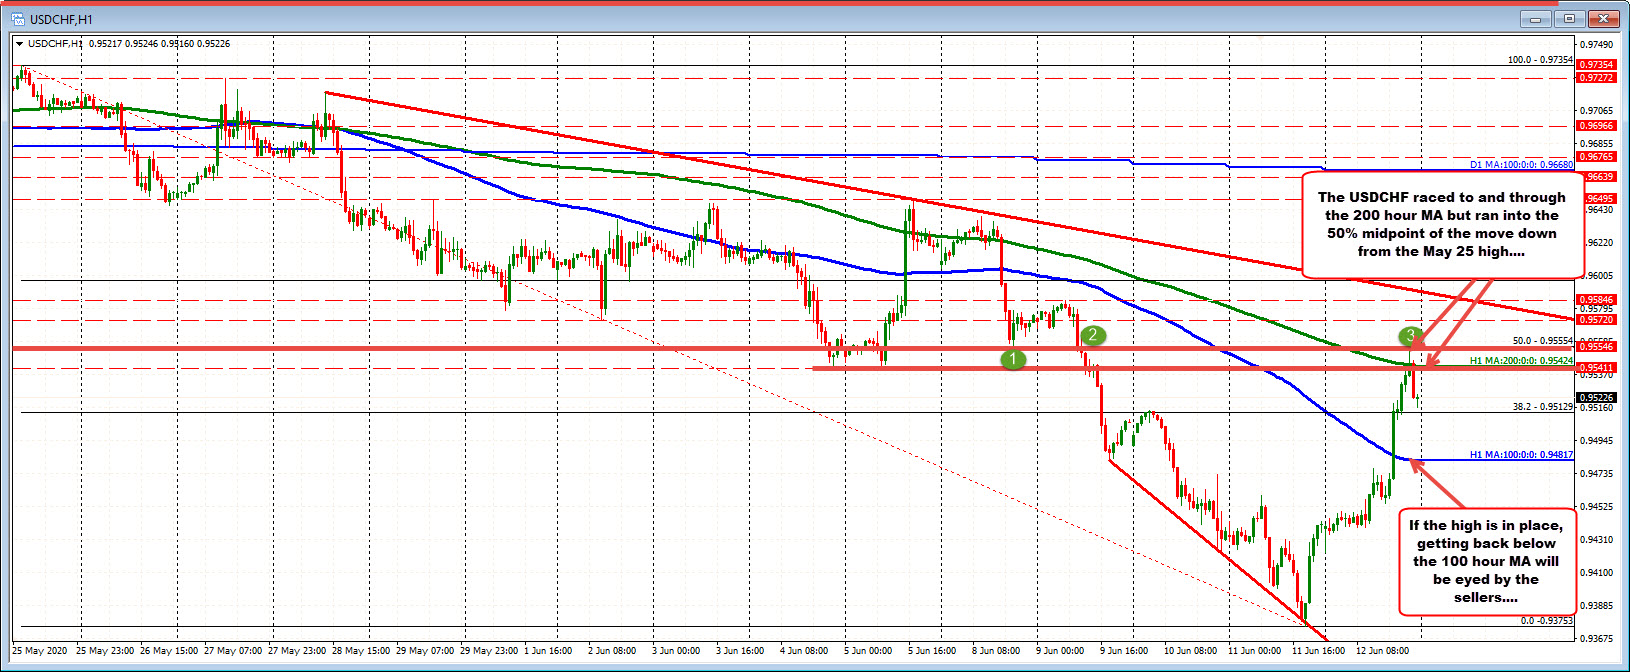
The price bottomed on Thursday with the low stalling against a lower trend line on the hourly chart. The price found willing buyers/profit takers against the risk defining level. The rebound saw the pair move back above its 100 hour MA yesterday, and also briefly above its 200 hour MA at 0.95424. However, the 50% midpoint of the move down from the May 25 high stalled the rise. That midpoint level came in at 0.95554 (PS it was also the swing low from Monday’s trading). The price ended the week moving back below the 200 hour MA.
In the new trading week, the combination of the 200 hour MA and 50% midpoint are always key barometers for the overall sentiment of any currency pair. As a result, they remain as key topside resistance levels for the pair into the new week.
If the price is to go higher (risk off on the back of rising stocks/yields), that area would need to be broken. It would open up the upside for more probing with the high from Tuesday at 0.95846, a downward sloping trend line at 0.9592 and the 61.8% at 0.95978 as the next targets.
Failure to do extend above the 200 hour/50%, and the technical focus will be back down at the 100 hour MA (blue line) at 0.94817. A move below that level would give the sellers more confidence that could ultimately lead to a retest of the low from last week.
USDCAD: The trend move lower from the May 22 high ran out of steam on Wednesday after the FOMC decision. The price tumbled to a low at 1.33144 – taking out the earlier week low at 1.33551. However, when the fall to new low quickly reversed, and support was reestablished at the Monday/Tuesday lows, the sellers turned to buyers, and the price rebounded higher.